Every chart below is a real, interactive M Chart embed. Explore each chart type, see a live chart beside its auto-generated image, plus examples of the annotations you can add with M Chart Pro.
Every chart type
Line
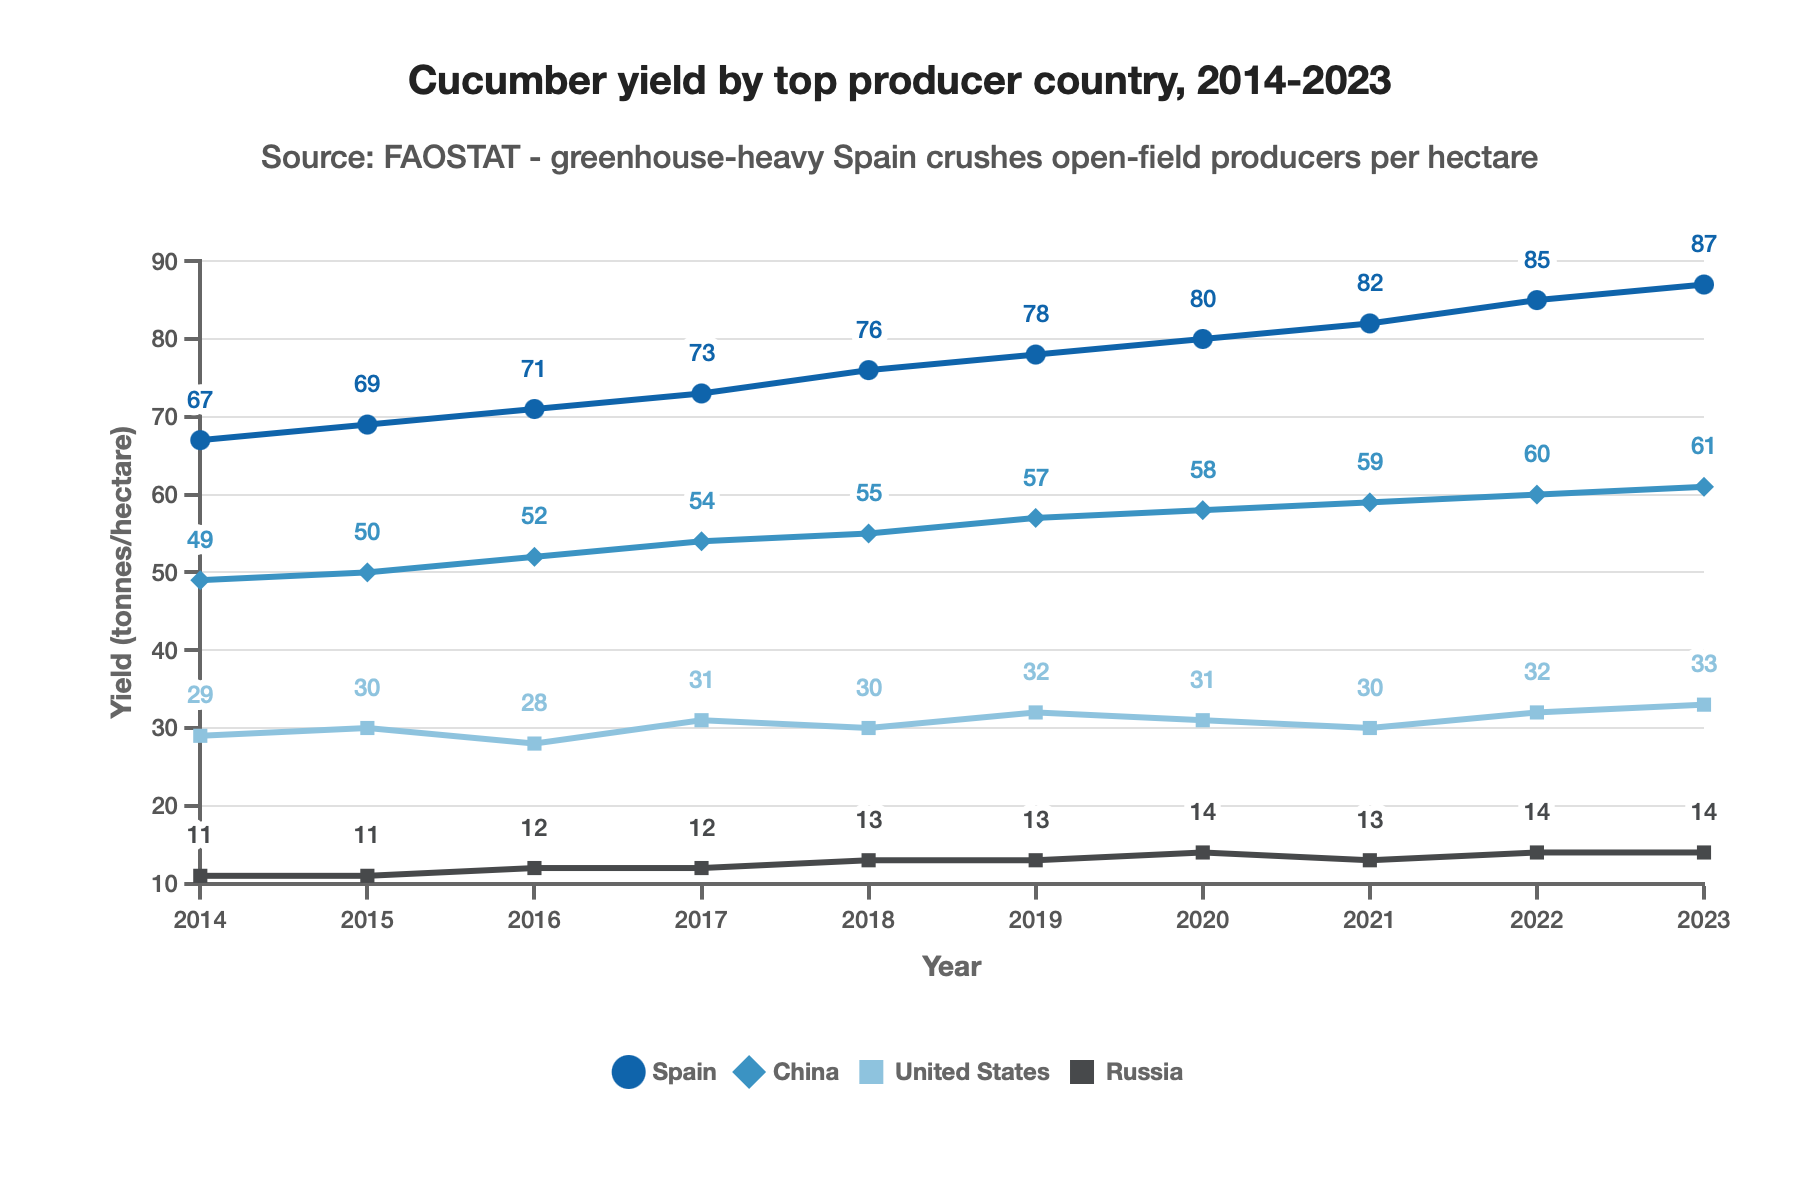
Cucumber yield by top producer country, 2014-2023: Source: FAOSTAT – greenhouse-heavy Spain crushes open-field producers per hectare
Cucumber yield by top producer country, 2014-2023
2014
2015
2016
2017
2018
2019
2020
2021
2022
2023
Spain
67
69
71
73
76
78
80
82
85
87
China
49
50
52
54
55
57
58
59
60
61
United States
29
30
28
31
30
32
31
30
32
33
Russia
11
11
12
12
13
13
14
13
14
14
A classic line chart for trends over a sequence.
Spline
Per-capita kimchi consumption in Korea: Source: KNHANES / KOSIS – grams per person per day, intermediate years interpolated
Per-capita kimchi consumption in Korea
2005
2008
2010
2013
2015
2017
2020
2023
100
92
87
80
72
70
65
60
A smoothed line chart with curved segments.
Area
South Korean kimchi exports: Source: KITA – 2017-2023 anchors firm, interim years interpolated
South Korean kimchi exports
2017
2018
2019
2020
2021
2022
2023
85,000,000
97,000,000
99,000,000
133,000,000
141,000,000
141,000,000
156,000,000
A line chart with the area below filled.
Column
Top cucumber-producing countries (2022): Source: FAOSTAT (2022) – China produces ~81% of global cucumbers
Top cucumber-producing countries (2022)
China
Turkey
Russia
Mexico
Uzbekistan
Ukraine
Spain
United States
Kazakhstan
Japan
77,260,000
1,940,000
1,640,000
1,080,000
900,000
830,000
770,000
600,000
570,000
550,000
Vertical bars for comparing values.
Stacked Column
Korean kimchi exports by destination: Source: KITA – figures in M USD, 2018-2023
Korean kimchi exports by destination
Japan
United States
Netherlands
Australia
Others
2018
50,000,000
15,000,000
8,000,000
4,000,000
20,000,000
2019
51,000,000
16,000,000
8,000,000
4,000,000
20,000,000
2020
66,000,000
25,000,000
10,000,000
5,000,000
27,000,000
2021
63,000,000
30,000,000
11,000,000
6,000,000
31,000,000
2022
61,000,000
30,000,000
12,000,000
6,000,000
32,000,000
2023
60,000,000
40,000,000
14,000,000
7,000,000
35,000,000
Vertical bars stacked to show composition.
Bar
Sodium content of signature pickles: Source: USDA FoodData Central – per-100g typical values, rounded to nearest 10mg
Sodium content of signature pickles
Zha cai (Chinese pickled mustard)
Gari (Japanese pickled ginger)
Dill pickle (US)
Olives (table)
Sauerkraut (German-style)
Sweet gherkin (UK)
Đồ chua (Vietnamese pickled daikon)
Kimchi (Korean)
Bread-and-butter pickle (US)
Sweet pickle (US)
3,700
1,300
1,100
730
660
570
600
500
470
460
Horizontal bars, great for long labels.
Stacked Bar
US pickle product mix by retail brand: Source: Grand View Research + Mordor Intelligence – per-brand attribution representative
US pickle product mix by retail brand
Dill
Sweet
Bread & Butter
Sour
Gherkin
Kosher
Vlasic
35
20
20
10
10
5
Mt. Olive
30
25
20
10
10
5
Claussen
50
10
10
10
10
10
Bay Valley
35
20
25
5
10
5
Best Maid
25
30
25
10
5
5
Horizontal bars stacked to show composition.
Pie
Chinese preserved-vegetable industry by category: Source: combined Chinese industry reports – output value in CNY billions, 2018-2020
Chinese preserved-vegetable industry by category
Sichuan pao cai (泡菜)
Other regional pao cai
Other pickled vegetables
Fuling zha cai (榨菜)
Northeast suan cai (酸菜)
Mei cai & preserved mustard
33 B CNY
14 B CNY
10 B CNY
9 B CNY
8 B CNY
5 B CNY
Proportions of a whole as slices.
Doughnut
Kimchi varieties by share of consumption: Source: WiKim & KNHANES – baechu is ~70% of marketed kimchi
Kimchi varieties by share of consumption
Baechu (napa cabbage)
Kkakdugi (cubed radish)
Chonggak (ponytail radish)
Oi-sobagi (stuffed cucumber)
Yeolmu (young radish)
Other (pa, gat, dongchimi, etc.)
70%
15%
5%
3%
3%
4%
A pie with an open center.
Scatter
Fermentation time vs final pH (4 pickle types): Source: multiple fermentation studies – curves synthesized from per-study trajectories
Fermentation time vs final pH (4 pickle types): Kimchi (15°C)
Days
pH
Day 0
0
5.6
Day 1
1
5.4
Day 3
3
4.7
Day 5
5
4.4
Day 7
7
4.3
Day 14
14
3.9
Day 21
21
3.85
Fermentation time vs final pH (4 pickle types): Sauerkraut
Days
pH
Day 0
0
6.2
Day 2
2
5.5
Day 5
5
4.2
Day 10
10
3.6
Day 14
14
3.4
Day 21
21
3.3
Fermentation time vs final pH (4 pickle types): Dill pickle (lacto)
Days
pH
Day 0
0
5.5
Day 1
1
5
Day 3
3
4
Day 5
5
3.6
Day 7
7
3.5
Day 14
14
3.3
Fermentation time vs final pH (4 pickle types): Pao cai (Sichuan)
Days
pH
Day 0
0
5.4
Day 1
1
4.9
Day 3
3
4.1
Day 5
5
3.9
Day 7
7
3.8
Day 14
14
3.7
Individual X/Y points to show distribution.
Bubble
Cucumber consumption × production × exports: Source: FAOSTAT + UN Comtrade – bubble radius = export volume
Cucumber consumption × production × exports
Consumption
Production
Export volume
China
55
55
80
Turkey
32
23
100
Russia
12
11
5
Mexico
8
8
500
Spain
15
16
200
Iran
26
26
10
Ukraine
18
36
30
US
1.8
1.8
30
Scatter points sized by a third value.
Radar
Flavor profile of 5 globally distinct pickles: Source: published sensory profiles – 1-10 ratings calibrated from cited descriptions
Flavor profile of 5 globally distinct pickles: Dill pickle (US)
Sour
Salty
Sweet
Umami
Spicy
Crunchy
7
7
2
3
1
8
Flavor profile of 5 globally distinct pickles: Kimchi (Korea)
Sour
Salty
Sweet
Umami
Spicy
Crunchy
7
7
2
8
8
6
Flavor profile of 5 globally distinct pickles: Pao cai (China)
Sour
Salty
Sweet
Umami
Spicy
Crunchy
8
6
3
5
7
7
Flavor profile of 5 globally distinct pickles: Tsukemono (Japan)
Sour
Salty
Sweet
Umami
Spicy
Crunchy
5
6
4
6
1
5
Flavor profile of 5 globally distinct pickles: Achaar (India)
Sour
Salty
Sweet
Umami
Spicy
Crunchy
6
7
3
4
9
4
Multivariate data on radial axes.
Radar Area
Nutritional profile (4 pickle types): Source: USDA FoodData Central – per-axis normalized to 0-100 for comparability
Nutritional profile (4 pickle types): Dill pickle
Sodium
Vitamin K
Vitamin C
Fiber
Calcium
30
89
6
38
31
Nutritional profile (4 pickle types): Kimchi
Sodium
Vitamin K
Vitamin C
Fiber
Calcium
13
38
100
75
67
Nutritional profile (4 pickle types): Sauerkraut
Sodium
Vitamin K
Vitamin C
Fiber
Calcium
18
16
83
91
40
Nutritional profile (4 pickle types): Zha cai
Sodium
Vitamin K
Vitamin C
Fiber
Calcium
100
100
17
100
100
A radar chart with filled areas.
Polar
Google Trends interest in “pickling” (US): Source: Google Trends – relative-interest index (0-100), peak month = 100
Google Trends interest in “pickling” (US)
Jan
Feb
Mar
Apr
May
Jun
Jul
Aug
Sep
Oct
Nov
Dec
30%
25%
25%
30%
40%
60%
80%
95%
100%
70%
50%
35%
Radial segments sized by value.
Treemap
Top table olive producers by region (2022/23): Source: IOC – 2022/23 crop year, Mediterranean basin dominates global table olive production
Top table olive producers by region (2022/23)
Country
Production
Mediterranean
Turkey
750,000 Tonnes
Mediterranean
Egypt
690,000 Tonnes
Mediterranean
Spain
540,000 Tonnes
Mediterranean
Algeria
280,000 Tonnes
Mediterranean
Greece
200,000 Tonnes
Mediterranean
Morocco
110,000 Tonnes
Mediterranean
Syria
100,000 Tonnes
Mediterranean
Italy
70,000 Tonnes
Americas
Argentina
150,000 Tonnes
Americas
Peru
100,000 Tonnes
Americas
United States
100,000 Tonnes
Nested rectangles sized by value.
Boxplot
Finished pH across 5 commercial pickle types: Source: USDA FoodData Central + FDA pH reference – 10 brand samples per category
Finished pH across 5 commercial pickle types
Dill pickle
Bread-and-butter
Sauerkraut
Kimchi
Pao cai (Sichuan)
3.4
3.48
3.55
3.6
3.65
3.7
3.75
3.82
3.9
4
3.05
3.1
3.15
3.2
3.25
3.3
3.35
3.42
3.5
3.6
3.35
3.42
3.5
3.58
3.65
3.72
3.78
3.82
3.88
3.95
3.85
3.95
4.05
4.1
4.18
4.25
4.32
4.4
4.5
4.65
3.45
3.55
3.6
3.65
3.72
3.78
3.85
3.92
4
4.1
Distribution with quartiles and whiskers.
Violin
Sodium content across commercial pickle brands: Source: USDA FoodData Central – 10 brands sampled per type from Branded Foods
Sodium content across commercial pickle brands
Dill pickle
Sweet pickle
Kimchi
Sauerkraut
950
980
1,050
1,100
1,150
1,180
1,210
1,250
1,300
1,350
380
410
440
460
470
490
510
540
580
620
380
420
450
470
490
500
520
560
600
650
500
550
580
620
660
680
710
740
780
820
Distribution shape with density.
One chart, two ways
Every M Chart embed is interactive, and M Chart also captures a static PNG of each chart automatically. The image can be used in emails, RSS feeds, AMP pages, and anywhere JavaScript can’t run, so your charts always have a clean fallback.
Live, interactive
Cucumber yield by top producer country, 2014-2023: Source: FAOSTAT – greenhouse-heavy Spain crushes open-field producers per hectare
Cucumber yield by top producer country, 2014-2023
2014
2015
2016
2017
2018
2019
2020
2021
2022
2023
Spain
67
69
71
73
76
78
80
82
85
87
China
49
50
52
54
55
57
58
59
60
61
United States
29
30
28
31
30
32
31
30
32
33
Russia
11
11
12
12
13
13
14
13
14
14
Hover for tooltips and toggle series in the legend. Rendered with Chart.js in the browser.
Static image (PNG)
The same chart as an auto-generated PNG, used for email, RSS, AMP, and no-JavaScript fallback.
Annotation examples for M Chart Pro
M Chart Pro lets you mark up any chart with up to six different annotation types — lines, boxes, ellipses, labels, points, and polygons. Here are a few charts shown side by side, without and with their annotations.
Without annotations
South Korean kimchi exports: Source: KITA – 2017-2023 anchors firm, interim years interpolated
South Korean kimchi exports
2017
2018
2019
2020
2021
2022
2023
85,000,000
97,000,000
99,000,000
133,000,000
141,000,000
141,000,000
156,000,000
With annotations · line & label
South Korean kimchi exports (with annotation): Source: KITA – 2017-2023 anchors firm, interim years
South Korean kimchi exports (with annotation)
2017
2018
2019
2020
2021
2022
2023
85,000,000
97,000,000
99,000,000
133,000,000
141,000,000
141,000,000
156,000,000
Without annotations
Korean kimchi exports by destination: Source: KITA – figures in M USD, 2018-2023
Korean kimchi exports by destination
Japan
United States
Netherlands
Australia
Others
2018
50,000,000
15,000,000
8,000,000
4,000,000
20,000,000
2019
51,000,000
16,000,000
8,000,000
4,000,000
20,000,000
2020
66,000,000
25,000,000
10,000,000
5,000,000
27,000,000
2021
63,000,000
30,000,000
11,000,000
6,000,000
31,000,000
2022
61,000,000
30,000,000
12,000,000
6,000,000
32,000,000
2023
60,000,000
40,000,000
14,000,000
7,000,000
35,000,000
With annotations · line & label
Korean kimchi exports by destination (with annotation): Source: KITA – figures in M USD, 2018-2023
Korean kimchi exports by destination (with annotation)
Japan
United States
Netherlands
Australia
Others
2018
50,000,000
15,000,000
8,000,000
4,000,000
20,000,000
2019
51,000,000
16,000,000
8,000,000
4,000,000
20,000,000
2020
66,000,000
25,000,000
10,000,000
5,000,000
27,000,000
2021
63,000,000
30,000,000
11,000,000
6,000,000
31,000,000
2022
61,000,000
30,000,000
12,000,000
6,000,000
32,000,000
2023
60,000,000
40,000,000
14,000,000
7,000,000
35,000,000
Without annotations
Chinese preserved-vegetable industry by category: Source: combined Chinese industry reports – output value in CNY billions, 2018-2020
Chinese preserved-vegetable industry by category
Sichuan pao cai (泡菜)
Other regional pao cai
Other pickled vegetables
Fuling zha cai (榨菜)
Northeast suan cai (酸菜)
Mei cai & preserved mustard
33 B CNY
14 B CNY
10 B CNY
9 B CNY
8 B CNY
5 B CNY
With annotations · label
Chinese preserved-vegetable industry by category (with annotation): Source: combined Chinese industry reports – output value in CNY billions, 2018-2020
Chinese preserved-vegetable industry by category (with annotation)
Sichuan pao cai (泡菜)
Other regional pao cai
Other pickled vegetables
Fuling zha cai (榨菜)
Northeast suan cai (酸菜)
Mei cai & preserved mustard
33 B CNY
14 B CNY
10 B CNY
9 B CNY
8 B CNY
5 B CNY
Without annotations
Top table olive producers by region (2022/23): Source: IOC – 2022/23 crop year, Mediterranean basin dominates global table olive production
Top table olive producers by region (2022/23)
Country
Production
Mediterranean
Turkey
750,000 Tonnes
Mediterranean
Egypt
690,000 Tonnes
Mediterranean
Spain
540,000 Tonnes
Mediterranean
Algeria
280,000 Tonnes
Mediterranean
Greece
200,000 Tonnes
Mediterranean
Morocco
110,000 Tonnes
Mediterranean
Syria
100,000 Tonnes
Mediterranean
Italy
70,000 Tonnes
Americas
Argentina
150,000 Tonnes
Americas
Peru
100,000 Tonnes
Americas
United States
100,000 Tonnes
With annotations · box & label
Top table olive producers by region (2022/23) (with annotation): Source: IOC – 2022/23 crop year, Mediterranean basin dominates global table olive production
Top table olive producers by region (2022/23) (with annotation)
Country
Production
Mediterranean
Turkey
750,000 Tonnes
Mediterranean
Egypt
690,000 Tonnes
Mediterranean
Spain
540,000 Tonnes
Mediterranean
Algeria
280,000 Tonnes
Mediterranean
Greece
200,000 Tonnes
Mediterranean
Morocco
110,000 Tonnes
Mediterranean
Syria
100,000 Tonnes
Mediterranean
Italy
70,000 Tonnes
Americas
Argentina
150,000 Tonnes
Americas
Peru
100,000 Tonnes
Americas
United States
100,000 Tonnes
We use necessary cookies to make this site work. With your consent, we also use Google Analytics to understand how it's used. Choose Accept to allow analytics, or Necessary Only for just the essentials. Our privacy policy