


About M Chart
A free WordPress charting plugin that’s been powering charts on thousands of sites for over a decade.
A bit of history
M Chart has one job: an efficient, easy-to-use way to manage data sets in a spreadsheet and display them as charts. Over 10+ years it has grown to support 19 chart types, multiple output formats, and full accessibility, while staying free.
Would you like a more detailed history and a description of where things are headed?
What M Chart does
- 19 chart types: line, spline, area, column, stacked column, bar, stacked bar, pie, doughnut, scatter, bubble, radar, radar area, polar, treemap, boxplot, violin, venn, and euler
- Two ways to enter data: a spreadsheet UI (Jspreadsheet CE) with multi-sheet support, or a fully keyboard-accessible CSV import with configurable delimiters
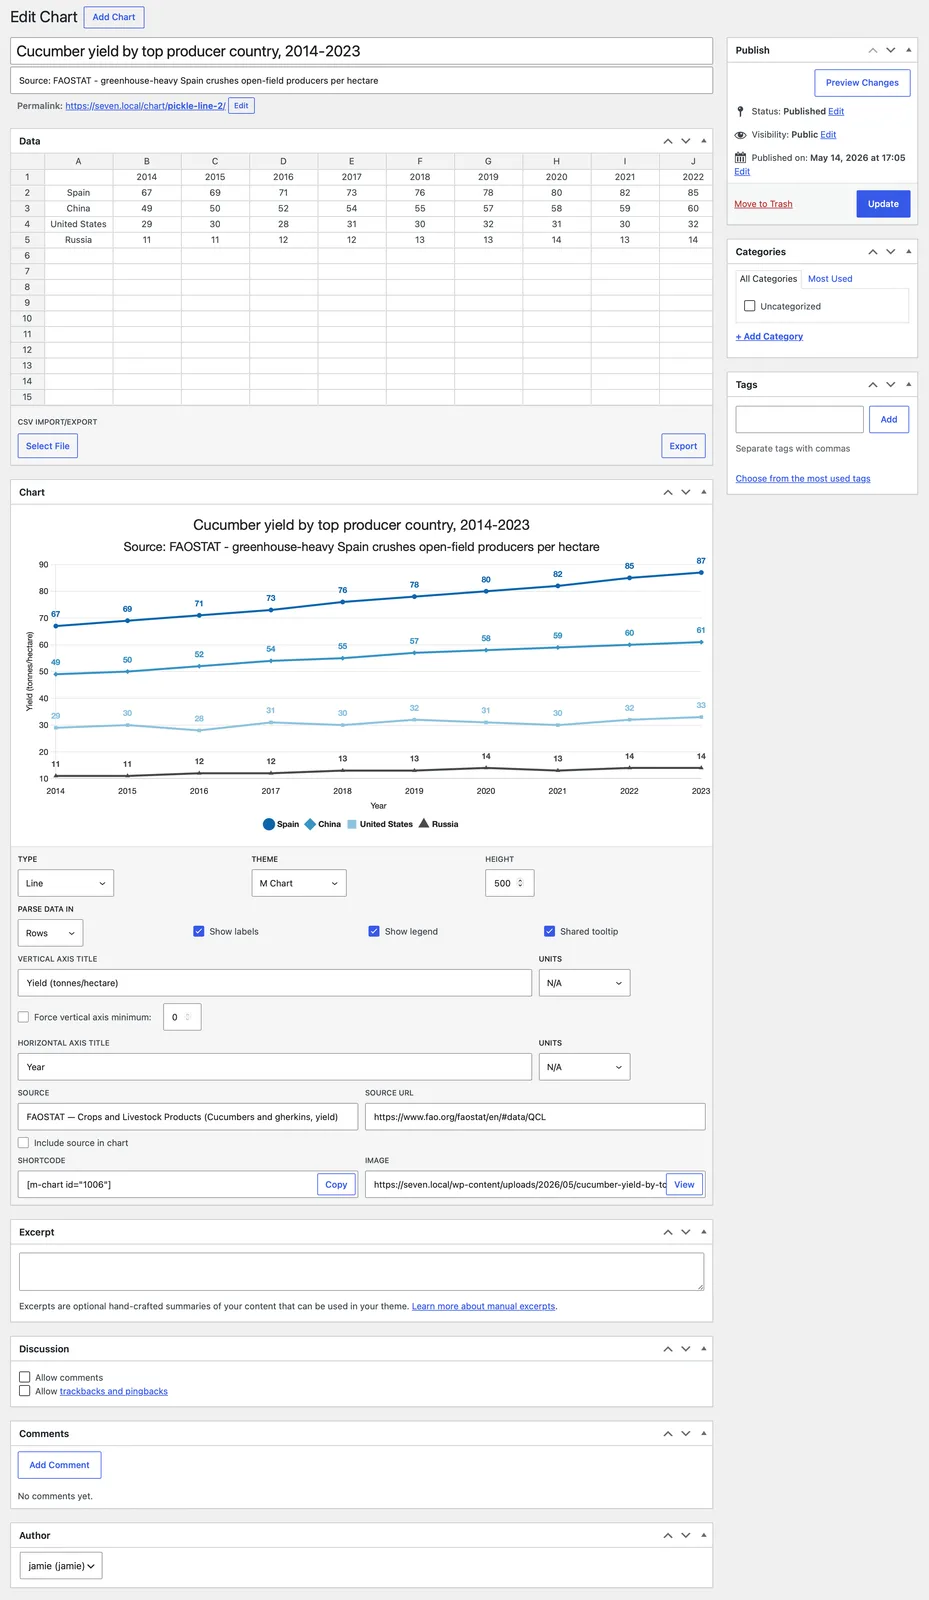
- Live preview: the chart redraws instantly as you edit your data and settings, so you can see exactly what you’ll get before publishing
- Multiple output formats: render as a live interactive chart, a static image, or a plain HTML data table, all from the same chart
- Automatic image generation: every chart is captured to a real PNG image automatically (no headless browser or external service required)
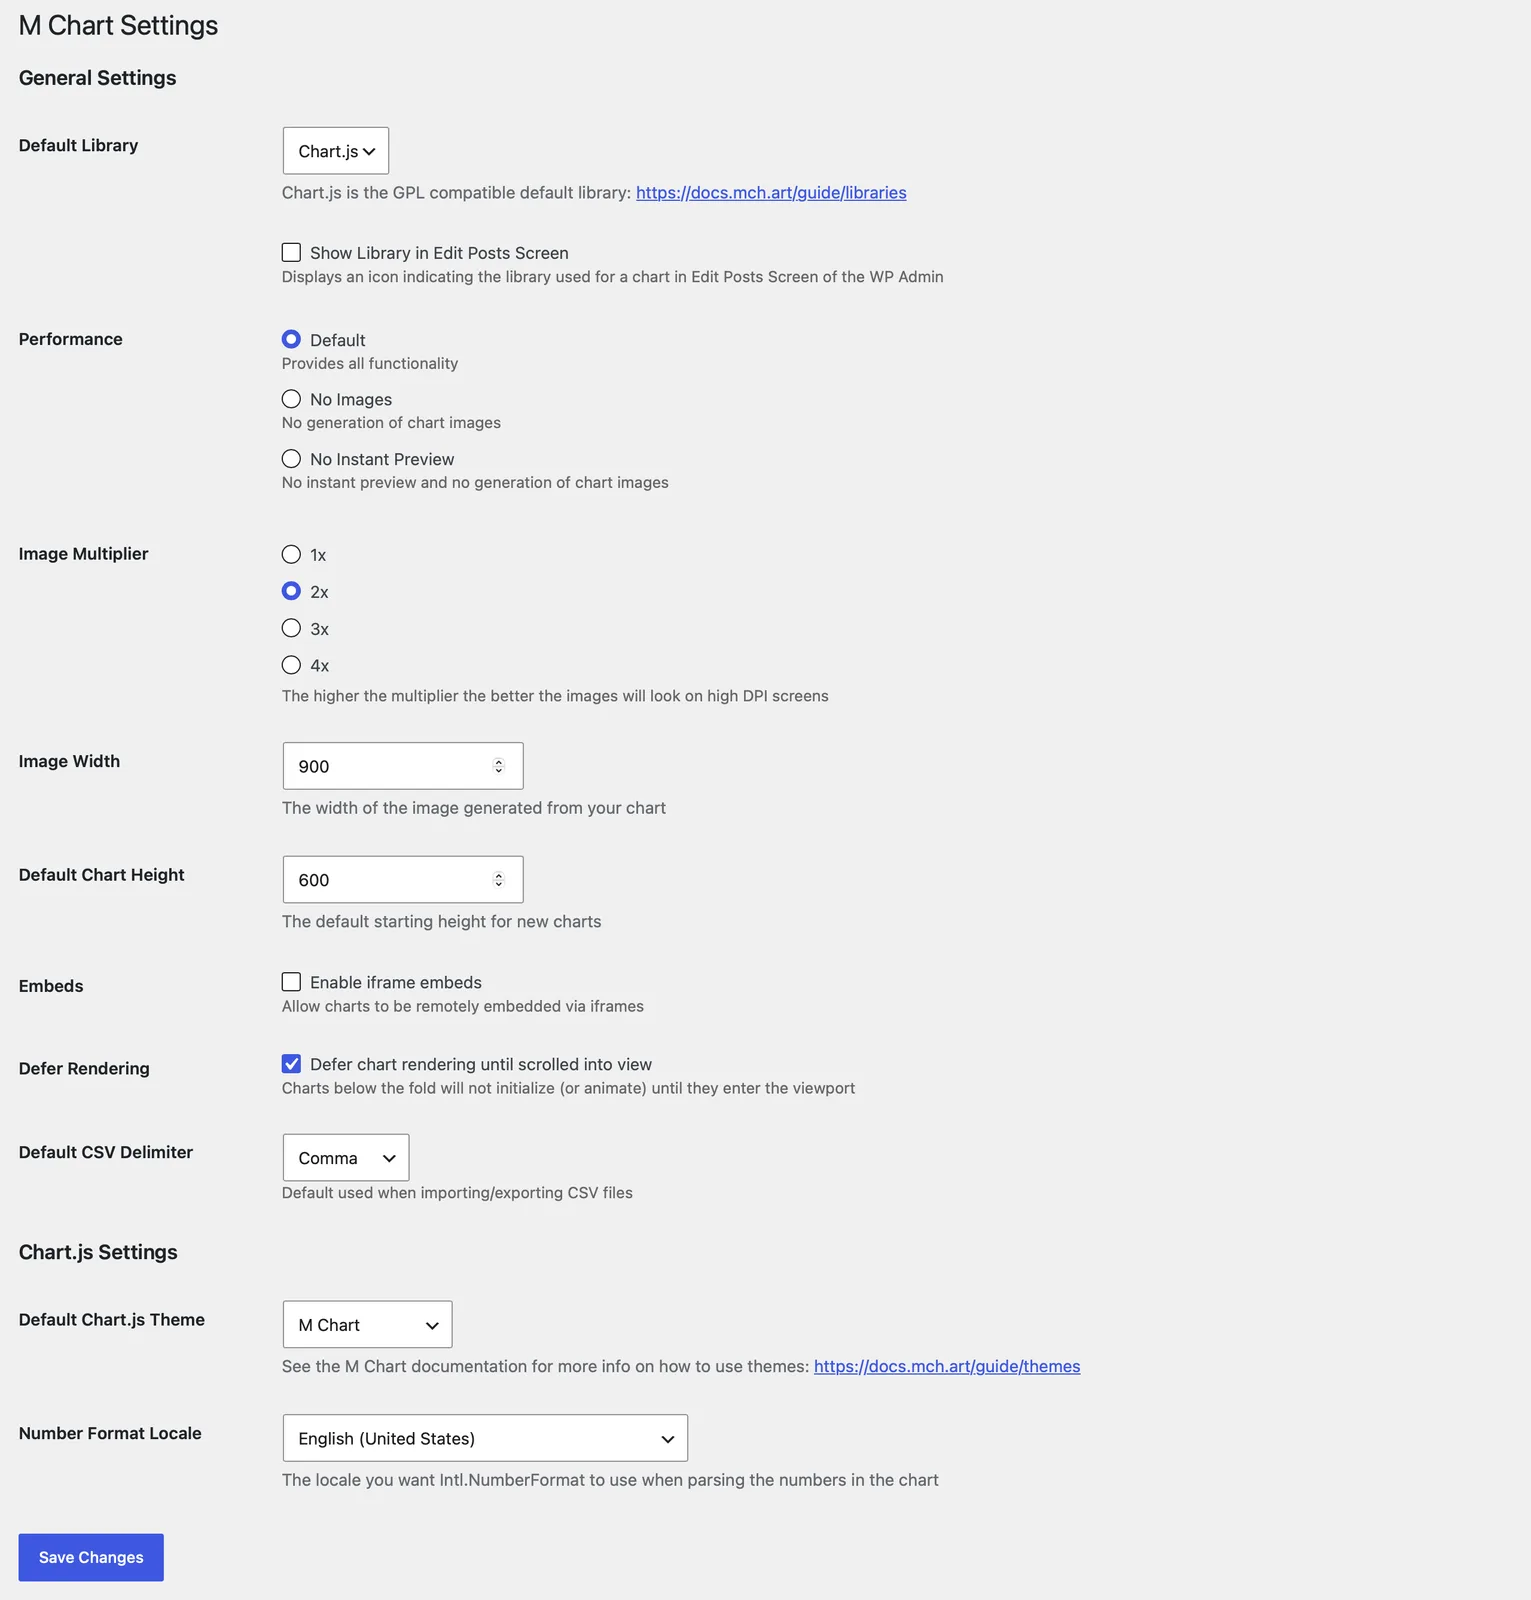
- Images have a configurable width and 1x–4x quality multiplier
- Perfect for RSS feeds, emails, AMP pages, and anywhere JavaScript doesn’t work
- Flexible embedding: shortcode, native block editor block, or iframe for remote/cross-site embedding
- Accessibility (WCAG 2.1 AA): every front-end chart includes a visually-hidden data table for screen readers, and a Color Blind Safe theme is bundled
- Themes: bundled Chart.js themes, switchable per install, including a Color Blind Safe palette
- Responsive and fast: charts size to their container, defer rendering until scrolled into view, and lazy-load in the block editor
- Localization: locale-aware number formatting, plus full translation support
- Per-chart customization: title/subtitle, axis titles and units, forced axis minimum, legend and shared-tooltip toggles, data-point labels, source attribution, and “color per data point”
M Chart changelog
2.3.2
- Fixed an issue where very old data could get parsed incorrectly
- Fixed an issue where WordPress could fail to detect M Chart Pro updates
- Updated the bundled Freemius SDK (2.13.4) and treemap chart plugin (4.2.0) to their latest versions
2.3.1
- Minor changes to support WordPress 7.1
2.3
- The M Chart Highcharts Library is now deprecated and M Chart offers one-click migration of Highcharts charts to Chart.js
- The M Chart implementation of Chart.js now matches Highcharts feature-for-feature, supports additional chart types, works with M Chart Pro, is more performant, and isn’t burdened by expensive commercial licensing requirements
- Sites with Highcharts charts see a migration notice – dismissible while the Highcharts library plugin is active, persistent when it isn’t (since those charts won’t display)
- Chart data carries over as-is – only legacy Highcharts theme slugs are remapped (to the bundled Highcharts 4.x look) and chart images refresh the next time each chart is saved
- Added support for venn and euler chart types
- Supports up to 5 sets
- Venn uses the classic fixed layout while euler sizes the circles proportionally to their totals
- Treemap labels now wrap to fit their rectangle so long labels stay readable instead of shrinking to fit on a single line
- Treemap group captions now wrap onto a second line when long group names need the room
- Tweaked table rendering so that it always matches the format of the data in the spreadsheet
- Fixed an issue where treemaps with 3 or more grouping levels could render gray instead of using the theme colors
- Fixed an issue where saving a chart could cause a fatal error when the chart’s library plugin wasn’t active
2.2.2
- Added a new m_chart_admin_initial_chart_args filter so extensions can modify or replace the chart args used for the editor’s initial preview render
- Removed some legacy slash-escaping left over from the pre-2.0 rendering stack and tightened up the JSON encoding of chart args along the way
2.2.1
- Improved the accessibility of the source attribution
- The source is now a real link that keyboard and screen reader users can reach, and it becomes visible when focused
- Improved the screen reader experience for charts
- Charts now announce a short summary (chart type, subtitle, and source, or the chart’s excerpt when one is set)
- The full data table is still available and can now be navigated as a proper table
- Data tables now include row headers in more cases when appropriate
- Added a Japanese (ja_JP) translation
- Various small code quality and efficiency improvements
- Fixed an issue in tooltips where empty data points could show a 0 or leave orphaned labels behind
- Fixed an issue where new charts could get a different default height than the one in the settings
- The Default Chart Height setting now also indicates its allowed range (300-1500)
- Fixed an issue where titles, subtitles, and axis titles containing special characters (e.g. &) could render as HTML entities on the chart
2.2
- Added support for M Chart Pro
- Added title/subtitle wrapping to the helper plugin
- This mostly prevents the squished text that you sometimes got with long titles or subtitles
- Made some efficiency and code improvements to the Chart.js helper plugin
- Some minor accessibility improvements
- Default theme is now M Chart specific and uses a new color palette
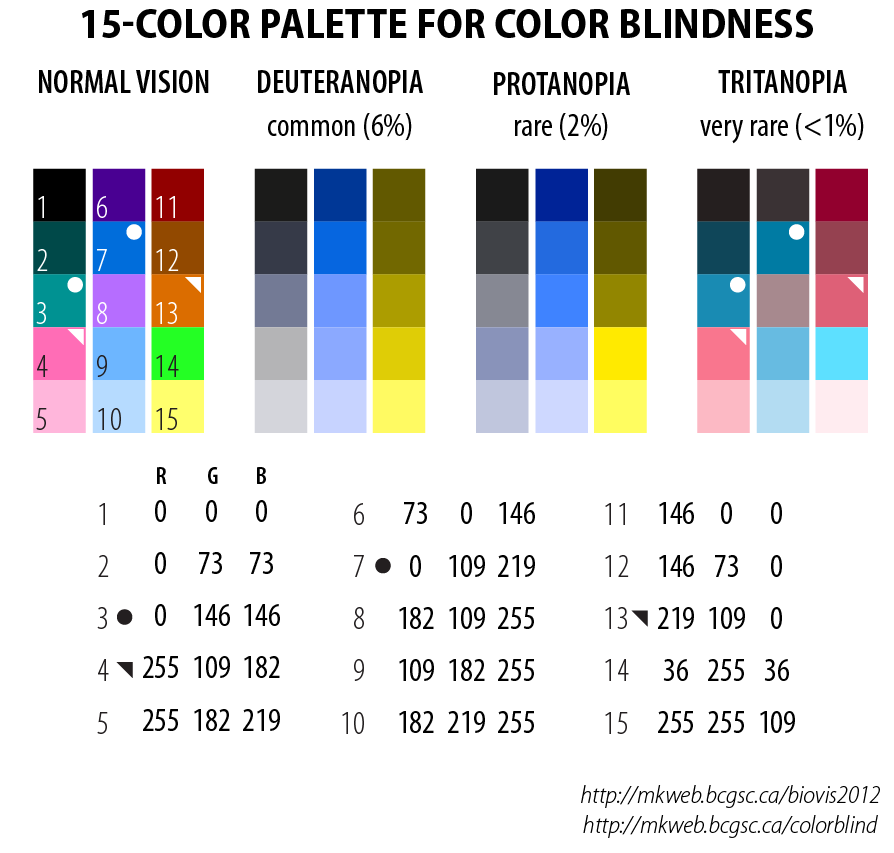
- Tweaked the Color Blind Safe palette to use the well regarded Okabe and Ito palette
- Also added different point shapes to further differentiate data series
- Fixed an issue where data in an unexpected format could crash the Admin UI
2.1
- Added support for Source and Source URL meta into the Chart.js implementation
- Source can be used simply for admin purposes to track sources of Data or displayed as link/text annotation added to the chart
- Added support for a treemap chart type
- Each row of [label, value] data becomes a rectangle sized by value
- Defaults to a single-color value-shaded look; can be switched to one color per rectangle via the new “Color per data point” toggle
- Treemap charts also accept hierarchical data – add 3 or more columns and the last column becomes the value while columns to the left become nested grouping levels (outermost first); leave the top-left cell empty to use row 1 as field-name headers and the names will show in tooltips and captions
- Added support for boxplot and violin chart types
- Each row in the spreadsheet is one distribution: first cell is the category, remaining cells are the values
- Min, Q1, Median, Q3, Max, whiskers, and outliers are computed automatically using the standard 1.5 x IQR rule
- Tooltips show the five-number summary on separate lines plus an outlier count when applicable
- Add additional sheets to compare distributions across groups – each sheet becomes its own dataset
- Added a “Color per data point” setting for Treemap, Column, and Bar charts
- This is only available if using a single series data set
- For example in a Column chart with a single series data set each column gets a different color cycled from the active theme palette instead of just one color for each column
- This is only available if using a single series data set
- Added a setting to defer chart rendering until charts scroll into view
- Inline Chart.js charts wait to instantiate (and animate) until their container enters the viewport
- iframe-embedded charts get the native
loading="lazy"attribute so they don’t load until they near the viewport - Enabled by default – uncheck the new “Defer Rendering” setting to restore the old behavior
- Refactored the Admin UI a bit to better fit the new WordPress 7 admin styles and input types
2.0
- Refactored the Admin UI to use React for all of the interface which results in some UI performance and functionality improvements
- Added a Copy button to the Shortcode input field
- Height and Force vertical axis minimum fields now resize to fit their contents
- Refactored PHP data parsing code to improve reliability and flexibility with differently formatted data
- Number values are now parsed to extract prefix and suffix strings allowing data to always be displayed with formatting and localization while still preserving prefixes and suffixes
- Refactored helper code as a Chart.js plugin instead of jQuery
- Helper code now formats and parses labels as well as tooltips
- Refactored Chart.js template to no longer be reliant on jQuery
- Refactored the Block interface to make some performance and UI improvements
- Reduced the number of queries required for the interface to function
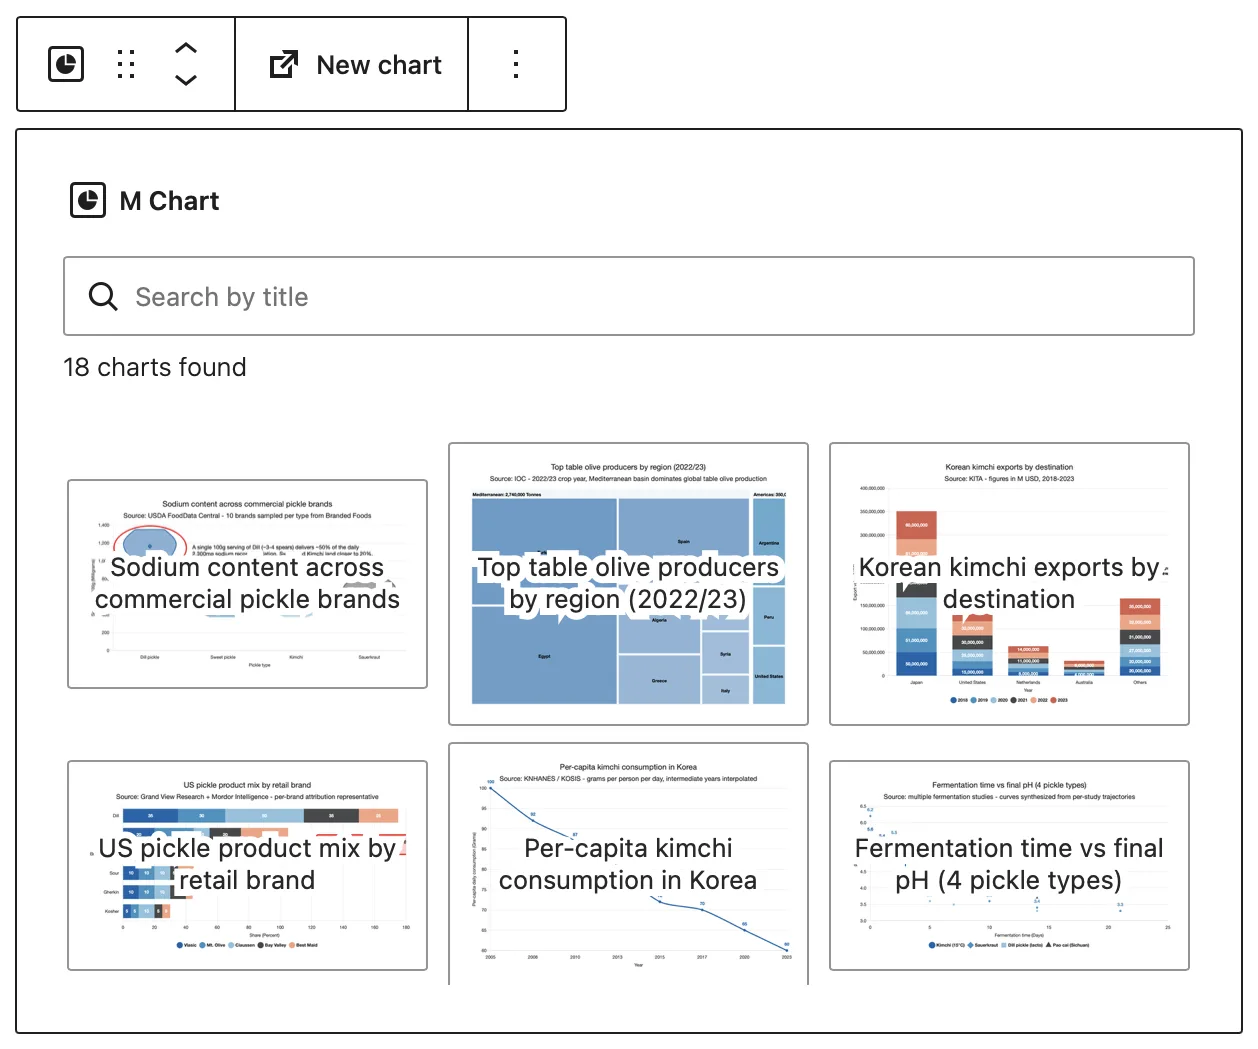
- Charts are now lazy loaded into the UI and subsequent charts are loaded as user scrolls
- Search now accepts any reasonable values you could expect in a post title
- Show attribute can now be controlled from the block UI
- Better handling of charts when Chart is missing an image or M Chart performance settings have disabled images
- Lots of additional code modernization and style improvements that didn’t effect functionality but should make code easier to maintain going forward
- Fixed an issue where a duplicate localization call could cause localization in the Block UI to not always load
- Fixed an issue where changing a cell value and then clicking Update could result in lost data and/or an incorrect image
1.12
- Switched from the old version (6.2.2) of Handsontable to Jspreadsheet CE (5.0.0)
- This removes reliance on a third party library that hadn’t recieved updates in a long time
- Refactored spreadsheet tab handling code a bit since some changes in browser event bubbling were causing issues
- Some style changes to deal with edge case UI issues in mobile situations
- Updated the build scripts to use npm instead of Grunt
- Deploy has moved to GitHub Actions
- Some SASS code and syntax cleanup
- Updated Chart.js to the latest stable version (4.5.1)
1.11.2
- Fixed a few PHP warnings that were occuring in specific situations
1.11.1
- Added alt text to the image version of a chart in the Block editor for better accessibility support
- Added chart title to the image version of a chart in the Block editor
- Added
arial-labelandroleattributes to the Chart.js canvas object for better accessibility support - Fixed an issue with translation text not making it into the Block interface
- Fixed an issue where Chart.js tooltips were sometimes missing a label
- Updated Chart.js to the latest stable version (4.4.3)
1.11
- Added a Chart Block for the WordPress Block Editor
- Send your thanks to webconstructor for the lion’s share of the work on this
- Added a CSV Delimiter control and setting to allow for differences in CSV files from different regions
- Fixed an issue where data points weren’t being cleaned well enough and it could confuse Chart.js
- Fixed an issue where Chart.js tooltips sometimes duplicated a label
- Fixed an issue with entities inside of labels
1.10.2
- Fixed another PHP warning that occured when trim was passed an untyped value (@webconstructor)
1.10.1
- Fixed a few issues where some PHP warnings could occur when a Chart had no data (@webconstructor)
1.10
- The default Chart.js theme now uses the default color pallette introduced in version 4.0.0
- If you preferred the older colors they’ve been moved to the Chart.js v3 theme
- Number formatting is now always handled by the native locale formating functionality in Chart.js
- Fixes an issue where large numbers sometimes didn’t display properly
- Fixed an issue where some missing output sanitation could allow for some XSS injection in a chart
- Thank you to Ngo Thien for reporting this
- Fixed an issue where the correct library wasn’t set when using multiple libraries
- Fixed an issue where the object cache could result in some Chart.js plugins not loading
- Fixed an issue where the port value wasn’t being handled by the
plugin_urlmethod (@turicasturicas) - Fixed an issue where custom Chart.js animations could be overwritten (@fcFn)
- Updated Chart.js to the latest stable version (4.2.1)
- If you’ve customized some Chart.js behaviors note that version 4.x includes a few breaking changes
- Updated chartjs-plugin-datalabels to the latest stable version (2.2.0)
1.9.4
- Added a setting to control the width of the image generation
- Updated Chart.js to the latest stable version (3.7.1)
- Updated canvg to the latest stable version (3.1.0)
1.9.3
- Fixed an issue where tick labels were getting mangled in certain situations
1.9.2
- Fixed an issue where the default theme was overwritten by the first library when multiple libraries are installed
- Fixed some issues with M Chart Settings that were introduced in M Chart 1.9
- Fixed an issue where the number formatting code is not always ready before a Chart.js chart renders
1.9.1
- Fixed an issue where the number formating code crashed the WordPress Block Editor
1.9
- Added support for stacked column, stacked bar, and doughnut charts when using Chart.js
- Added support for data point labels when using Chart.js
- Uses the chartjs-plugin-datalabels plugin
- Added better number formatting for Chart.js
- Uses Intl.NumberFormat and a locale set in the M Chart Settings panel to properly format numbers when possible
- Made some tweaks to how tables are rendered so the results are more sensible
- Tweaked plugin behavior when multiple libraries are installed
- You can now add a new chart in both the default and other installed libraries
- You can now update the settings for all of the installed libraries instead of just the default
- Fixed an issue where double quotes in a label could cause Javascript errors
- Fixed a few PHP warnings that could occur when editing a chart
- Updated Chart.js to the latest stable version (3.7.0)
- Updated ParseCsv to the latest stable version (1.3.2)
1.8.1
- Fixed an issue where not all of the arguments were being fed to functions attached to the_title filter hook
- Fixed an issue where handlebars wasn’t always enqueued when needed
1.8
- Added support for spline, area, scatter, bubble, radar, radar area, and polar charts when using Chart.js
- Chart.js can now use themes
- Default themes:
- Chart.js (Default)
- Based on the Chart.js homepage colors
- Color Blind Safe
- Highcharts 4.x
- Chart.js (Default)
- Default themes:
- Many additions/tweaks to Chart.js support
- Charts can now use the Vertical axis minimum value field
- Charts can now use the Shared tooltip setting
- Charts use different symbols for each data set when possible
- Circle, Diamond, Square, Triangle, etc…
- Tooltips have been tweaked to include more information
- Added two columns to the admin panel chart posts page
- Chart Type
- Chart Library (optional)
- Added an Image Multiplier setting to allow for higher or lower quality images (1x, 2x, 3x, or 4x)
- A 2x multiplier has been the existing behavior
- Some minor UI tweaks to support WordPress 5.7 changes
- Fixed an issue where chart didn’t update when changes were made to a new spreadsheet
- Fixed an issue where axis units weren’t displayed in Chart.js when there was no axis title
- Fixed an issue where the auto generated chart images could end up distorted
- Fixed an issue where the auto generated chart images were blurry when using Chart.js
- Removed Dark Mode plugin support
- The scope/purpose of this plugin changed drastically
- Removed Shortcake shortcode ui
- Shortcake hasn’t been updated in over 2 years
- Updated canvg to the latest stable version (3.0.7)
- This fixes an issue with image generation when using the Highcharts library
- Updated Chart.js to the latest stable version (3.2.0)
- Updated Handsontable to the latest stable version with an MIT license (6.2.2)
- Since I can’t get any bug fixes going forward I’ll be looking into alternatives for future versions
1.7.11
- Fixed an issue in WordPress 5.5 where jQuery sometimes wasn’t available in time for embedded charts
1.7.10
- Fixed some minor style issues in WordPress 5.5
- Fixed some issues with the admin Javascript when the plugin is used in WordPress 5.5
- Updated Chart.js to the latest stable version (2.7.3)
1.7.9
- Changed the priority of the
template_redirectfilter hook call so thatm_chart()->is_iframeget’s set earlier
1.7.8
- Fixed an issue that caused a few PHP warnings on the Charts page of the admin panel
1.7.7
- Fixed an issue that caused a PHP warning about a non-numeric value in class-wp-rewrite.php
1.7.6
- A few PHP notice fixes
- Updated Chart.js to the latest stable version (2.7.3)
- Updated Handsontable to the latest stable version (6.2.1)
1.7.5
- Added an additional check for the post id value in the edit interface
- Added an additional check for datasets data in the Chart.js code when adding colors
- Fixed an incorrect reference to the plugin version
1.7.4
- Improved data handling for non pie charts (when using Chart.js)
- Moved chart type tracking from the post_tag taxonomy to a specific m-chart-library taxonomy
- Updated Handsontable to the latest stable version (5.0.2)
- Fixed an issue where the
get_chartmethod would still try to load the template file for an invalid or non active chart type- Also better handling in general when a chart requires the Highcharts library and it is either not installed or inactive
- Fixed an issue where Chart.js sometimes wasn’t enqueued because of an erroneous dependency
1.7.3
- Fixed an issue where charts couldn’t be saved if the data didn’t yet include labels that M Chart could find (when using Chart.js)
1.7.2
- Added styles for the Dark Mode plugin
- Fixed an issue where new charts couldn’t be saved after making changes when there was an empty data set (when using Chart.js)
1.7.1
- Fixed an issue that could prevent new charts from being created when using Highcharts
1.7
- Updated Handsontable to the latest stable version (5.0.0)
- Major restructuring changes to meet WordPress Plugins directory requirements
- Switched default graphing library to Chart.js (2.7.2)
- Chart.js is more limited in functionality than Highcharts and the features of the core plugin are scaled back to reflect this
- Chart types are reduced and customizability is limited
- Chart.js is more limited in functionality than Highcharts and the features of the core plugin are scaled back to reflect this
- Removed Highcharts completely from the core plugin
- To continue using Highcharts install the M Chart Highcharts Library plugin
- This plugin reinstates ALL of the previous functionality found in M Chart
- To continue using Highcharts install the M Chart Highcharts Library plugin
- Switched default graphing library to Chart.js (2.7.2)
1.6.3
- Reworked the iframe embed code so differences in themes shouldn’t cause issues anymore
1.6.2
- Simplified Chinese (zh_CN) translation corrections
- Fixed an issue with PHP 7.1+ installs
1.6.1
- Fixed an issue where the placeholder image was used when a valid image existed
1.6
- Added support for scatter and bubble charts
- Charts can now be loaded via iframes (this enables remote embedding among other things)
- Line, spline and area charts can now use shared tool tips
- Added language settings to allow things like setting the thousands seperator and decimal symbols
- Switched to internal array_merge method in the theme code so we can recursively merge settings
- Tweaked the theme code a bit so we can support older versions of PHP
- Filtering
the_contentto now return chart code when appropriate - Updated Highcharts to the latest stable version (5.0.7)
- Updated Handsontable to the latest stable version (0.31)
1.5.2
- Fix for image performance options which would disable form submission in some situations
1.5.1
- Fix for image generation due to changes in Highcharts 5.0
1.5
- Added support for the AMP plugin
- Shortcode can now output a HTML table instead of a chart
- Updated Handsontable to the latest stable version (0.29)
- Updated Highcharts to the latest stable version (5.0.2)
- Tweaked how taxonomies are assigned so we don’t unintentionally inherit them from other plugins
1.4.1
- You can now display the same chart more than once on a single page
1.4
- Added Vertical axis minimum value field
- Fixed an issue where a notice error could occur when chart caches are being refreshed
1.3.2
- Fixed an issue where a notice error could occur when saving a chart
1.3.1
- Upped the chart height limit to 1500px
- Fixed an issue where notice errors were causing syntax errors in the Javascript when PHP errors are sent to screen
1.3
- Added a subtitle field which is used in the Highcharts subtitle attribute
- Noting that PHP >= 5.3.6 is required in the readme
- Also checking manage_options permission when saving settings
- Added a Simplified Chinese (zh_CN) translation
- The Color Blind Safe theme is now based on a palette by Martin Krzywinski
1.2.1
- Now using manage_options permissions for the settings panel
1.2
- Added themes
- Default themes:
- Highcharts 4.x (Default)
- Color Blind Safe
- Highcharts 3.x
- Highcharts 2.x
- Default themes:
- Added a settings panel
- Turn off/on image generation and/or instant chart previews
- Set default Highcharts theme
- Added full language support
- Now we just needs some translations
- Simplified the admin panel CSS a bit
- Fixed a display issue with the spreadsheet interface
- Fixed a bug where the Source URL wasn’t making into the charts
- Updated Handsontable to the latest stable version (0.24.1)
- Updated Highcharts to the latest stable version (4.2.1)
1.1.5
- Updated Highcharts to the latest stable version (4.2.0) this fixes an issue where bar charts could cause an Uncaught TypeError in some WP themes
1.1.4
- Updated Handsontable to the latest stable version (0.15.1) this fixes a copy/paste issue in the spreadsheet for some browsers
1.1.3
- Fixed an issue where the Highcharts options where sometimes being set before Highcharts was available
1.1.2
- Fixed an issue where subsequent charts on the same page inherited the data from the previous chart
1.1.1
- Fixed a bug where data sets with only one row/column of data that also had only one row/column of labels would fail to display in chart types other than pie
1.1
- Added a Shortcake shortcode ui
- Added
canvas_doneJavascript event - Added
m_chart_admin_footer_javascriptAction hook - Fixed a PHP warning that occured when adding a new chart that had no data yet
1.0
- Initial release
What M Chart Pro adds
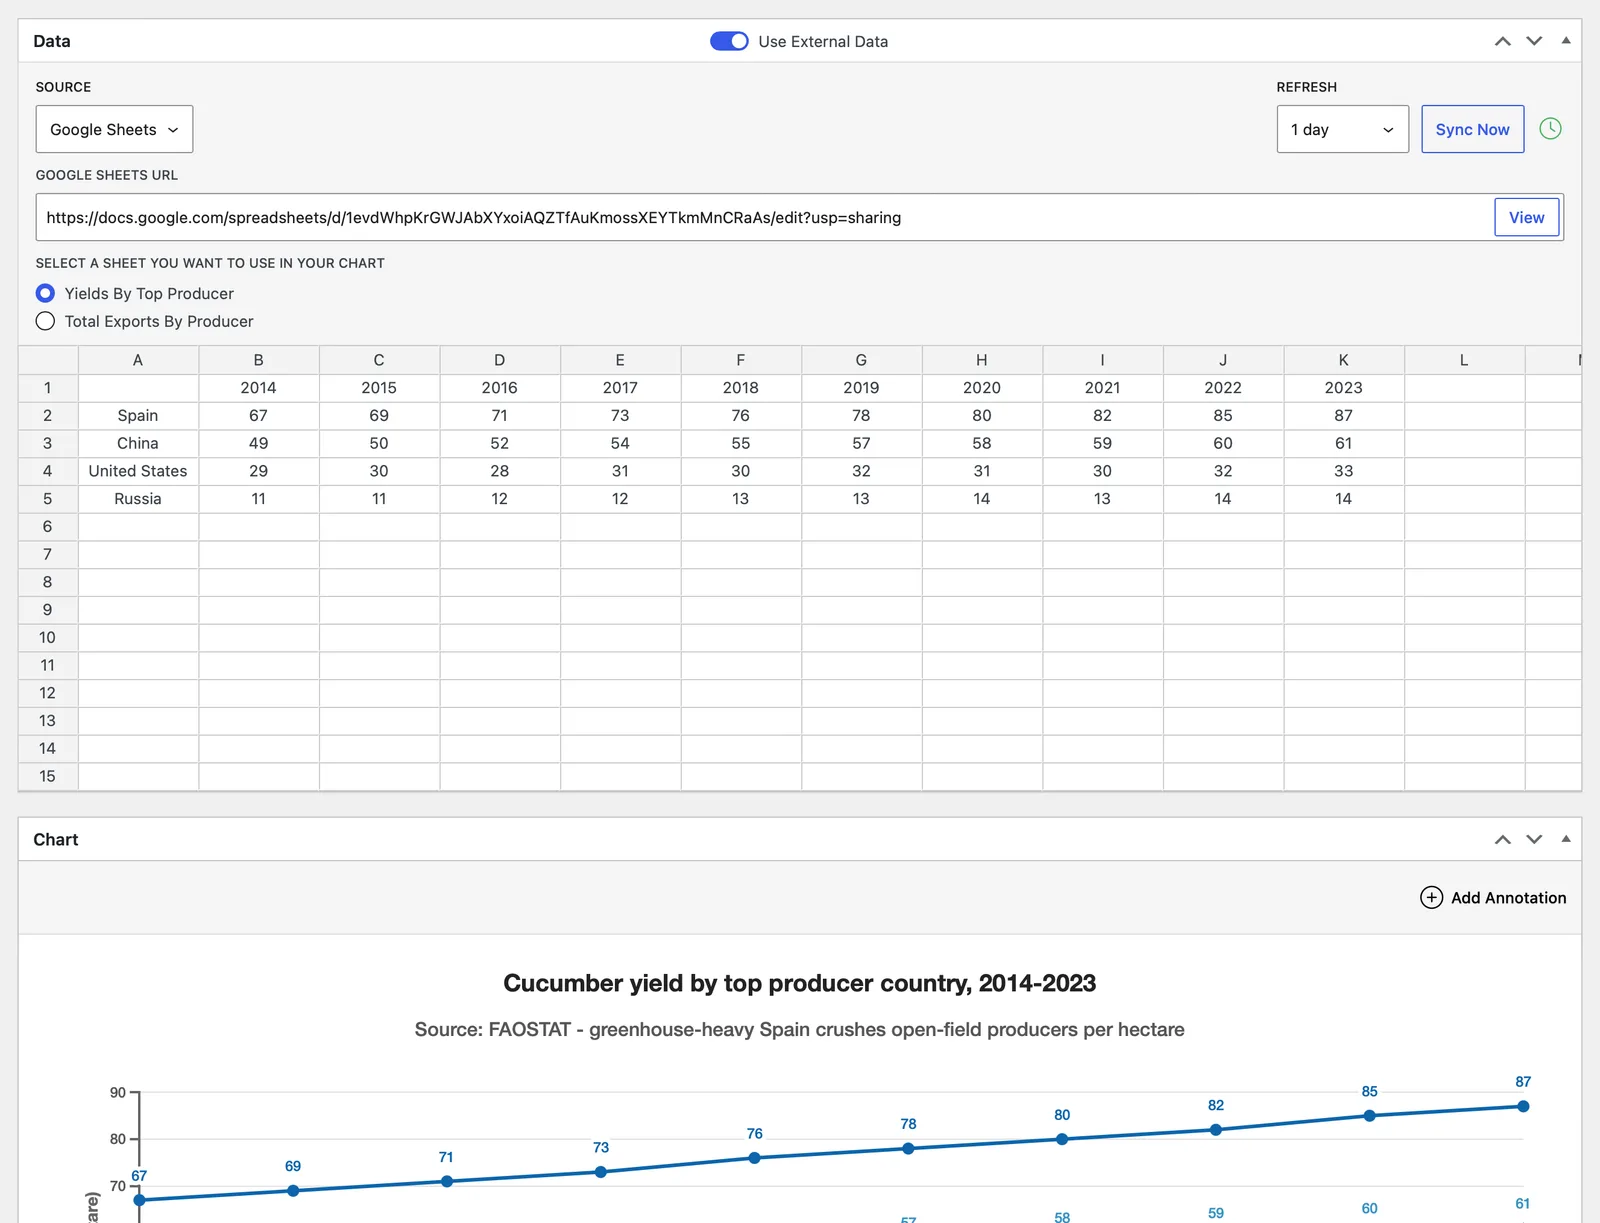
- External Data: keep a chart’s data in sync with a spreadsheet or file hosted elsewhere, so you never re-enter numbers by hand.
- Google Sheets: paste a share link and pick one or more tabs, each becoming its own data set; private sheets are supported through a Google service account
- Remote CSV: pull from one or more CSV URLs, named per data set, using your site’s CSV delimiter
- Local MySQL: build a chart from a read-only SELECT query against your WordPress database, one query per sheet (admins only)
- Remote MySQL: connect to another MySQL server over SSL and chart the results of read-only SELECT queries, with the password stored encrypted and an optional CA certificate for servers using self-signed or private-CA TLS (admins only)
- Scheduled auto-refresh: refresh every 30 minutes, hour, 6 or 12 hours, or 1, 2, or 3 days, set per chart or from a global default
- Sync Now: refresh on demand from the chart editor, even with an unsaved URL
- Status at a glance: a Sync column on the Charts list shows OK, Error, or Never, and an admin notice flags any chart that fails repeatedly, with its error
- Safe by design: a failed sync leaves your existing data untouched and retries on the next interval, remote hosts are validated to block server-side request forgery, and MySQL queries are restricted to read-only SELECTs that run under a read-only transaction with row limits
- Smart Data Selection: automatically detects which rows and columns of the spreadsheet are valid chart data and keeps the rest out of the chart.
- Automatic: stray notes, blank lines, and leftover cells are ignored on the fly, including a corner label cell when the data calls for it
- Non-destructive: the spreadsheet always keeps the full data, and ignored cells are shaded so it’s clear what the chart is using
- Manual mode: turn automatic selection off and checkboxes appear right in the grid for picking exactly which rows and columns feed the chart, by inclusion or exclusion, per sheet, with an option to automatically include new rows and columns as your data grows
- Works everywhere: with manually entered data and with External Data
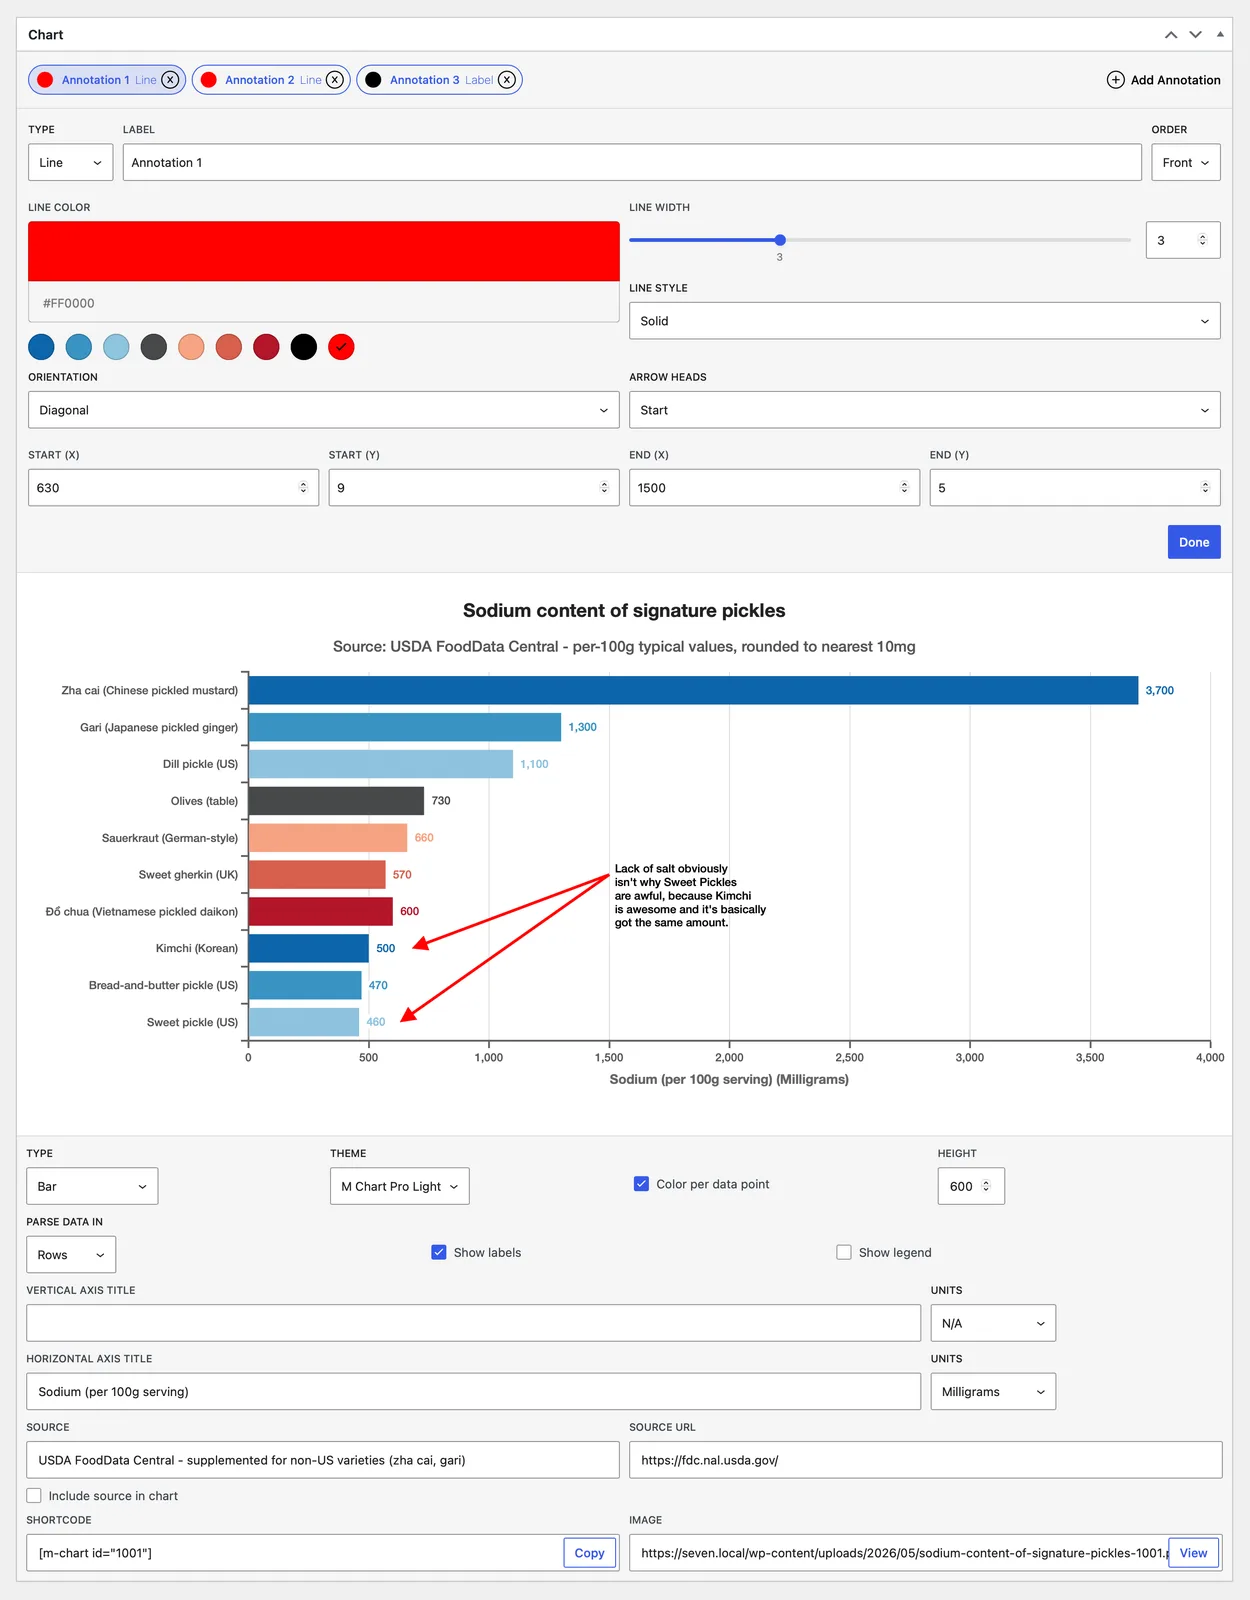
- Annotations: mark up a chart with lines, shapes, and text that render on the live chart and in iframe embeds.
- Six types: Line (horizontal, vertical, or diagonal, with optional arrowheads), Box, Ellipse, Label, Point, and Polygon
- Round charts too: place annotations on pie, doughnut, radar, and polar charts by angle and distance from center, not just on X/Y charts; on treemaps, pin labels, points, and boxes to specific cells; on venn and euler charts, target a set or intersection by name and the annotation anchors to that region
- Full styling: border color, width, and dash; fill color; and, for labels, complete typography with an optional background box
- Built for editing: up to 50 per chart, drag to reorder, send to front or back, with a live preview as you place them
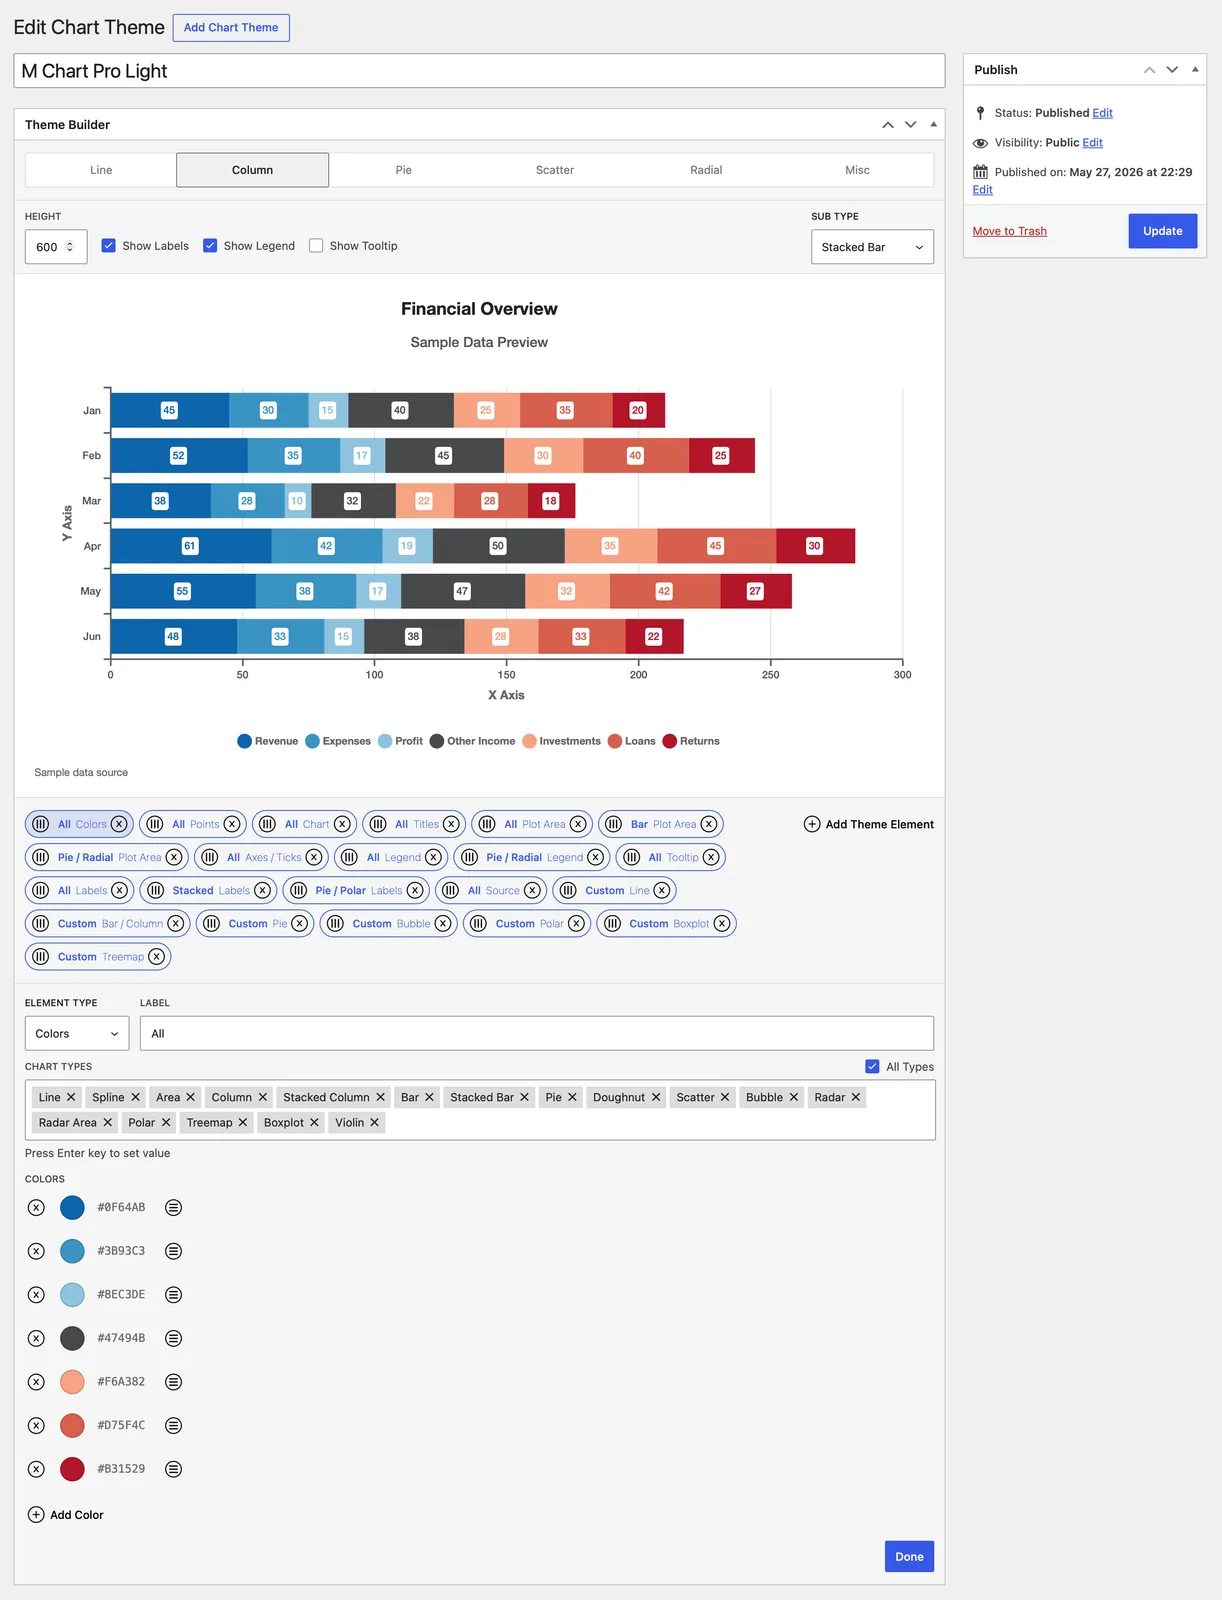
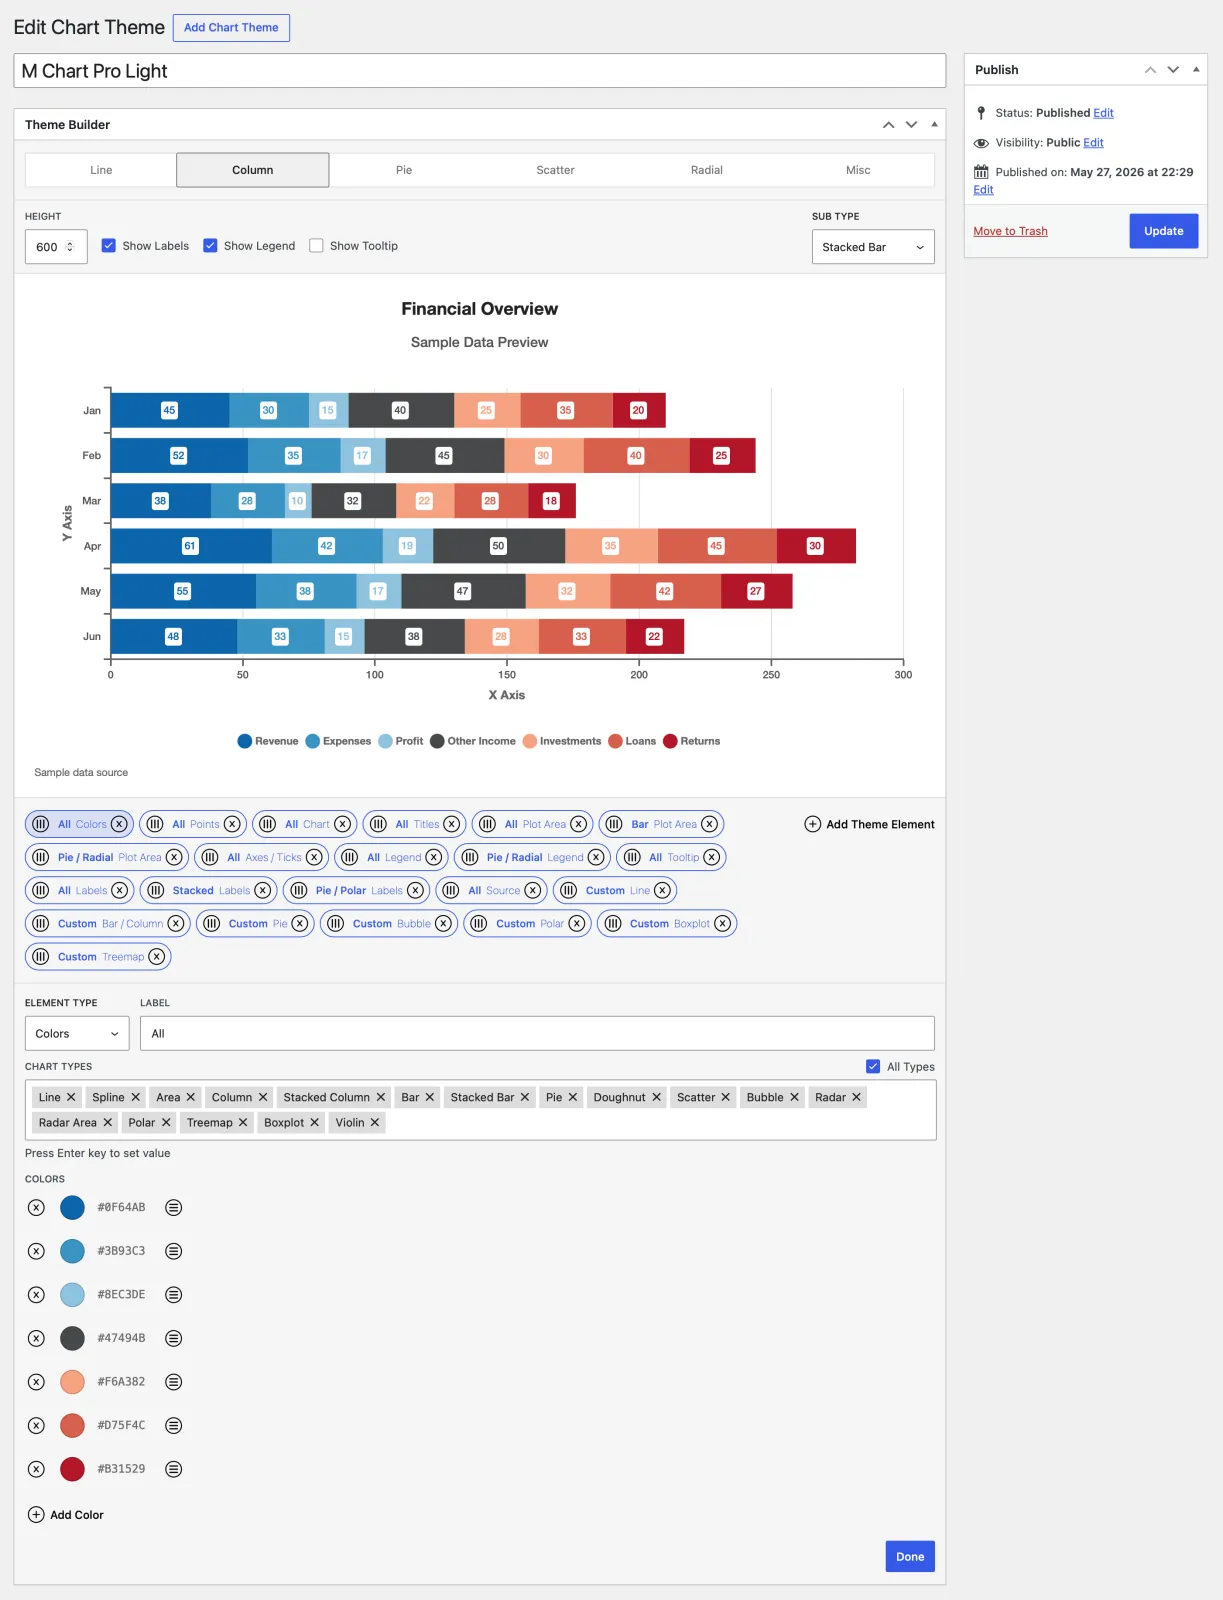
- Theme Builder: a visual Theme Builder for creating reusable, named themes that restyle every part of a Chart.js chart; two starter themes (M Chart Pro Light and Dark) are bundled, and the builder shows a live preview as you work just like you’re used to when editing your charts.
- Color palettes: define the series color cycle and set background, border, and fill colors, with opacity, throughout the chart
- Typography: built-in font stacks, Google Fonts or Adobe Fonts (auto-loaded for you), or your own @font-face, with independent size, weight, style, color, and alignment for titles, axis titles and labels, the legend, tooltips, and data labels
- Data styling for every chart family: line width, dash, curve, and fill; bar border, radius, and width; pie, doughnut, and polar slice spacing and “explode” offsets; point markers in several shapes with sizes and hover styles; plus bubble, treemap, boxplot/violin, and venn/euler region styling
- Layout and chrome: chart padding and background; plot-area background, border, and gridlines; legend position and spacing; tooltip styling; and axis lines, ticks, and labels, including radial grid shape, angle lines, and tick backdrops for round charts
- On-chart overlays: add custom text, an image or logo, and a source-attribution line, layered in front of or behind the data
- Targeted styling: scope any styling element to all chart types or only specific ones, with up to 50 elements per theme
M Chart Pro changelog
1.1.2
- Fixed an issue where WordPress could fail to detect M Chart Pro updates
1.1.1
- Theme Builder support for M Chart’s new Venn and Euler chart types
- A new Venn / Euler theme element styles the region outlines, fill opacity, and both label fonts (set names and in-region values)
- The Venn / Euler element can also add a text outline and a label box behind each label type
- The Plot Area element’s Radial Padding insets Venn and Euler charts
- Venn and Euler are available as Theme Builder preview types and in each element’s chart type targeting
- Region fills follow the theme’s color palette automatically
- Annotations support for Venn and Euler charts
- Label and Point annotations target a set or an intersection by name and anchor at the region’s own label position, following the diagram’s layout at any size
- One annotation can target multiple regions at once, with optional pixel or percent offsets to nudge placement
- Fixed an issue where the theme builder was ignoring colors for Treemap charts
- Minor changes to support WordPress 7.1
1.1
- Smart Data Selection
- Automatically detects which rows and columns of the spreadsheet are valid chart data and ignores the rest
- Examples of data that would be ignored
- Stray header word in the first cell
- Unlabeled column of values
- Labeled row with no data
- Examples of data that would be ignored
- Completely non-destructive, the spreadsheet always keeps the full data, and ignored cells are shaded so it’s clear what the chart is using
- Turn the automatic mode off to pick exactly which rows and columns feed the chart, by inclusion or exclusion, per sheet
- An option to automatically include new rows and columns as your data grows, ideal for charts fed by External Data
- Works with manually entered data and with External Data
- Automatically detects which rows and columns of the spreadsheet are valid chart data and ignores the rest
- New Local MySQL and Remote MySQL External Data sources
- Chart the results of read-only SELECT queries, one query per sheet
- Local MySQL queries your WordPress database; Remote MySQL connects to another server over SSL with an encrypted password
- Queries are restricted to read-only SELECTs and run under a read-only transaction with row and size limits so a chart can’t strain the database
- Limited to Admins because they provide direct database access
- Fixed an issue where Google Sheets data fetched via the API could come back with unevenly sized rows
1.0.1
- Improved external data syncing
- Saving a chart with a new source URL no longer makes the save wait for the fetch to finish, the sync now runs in the background right after the save (the Sync Now button still gives immediate feedback)
- Added a “Site default” option to the Refresh setting so a chart can follow the global default even when that changes later
- Google Sheets syncs now make fewer requests to Google per refresh
- Remote fetches now cap the response size so an oversized file can’t exhaust server memory
- Failed syncs through the REST endpoint now return proper HTTP error codes
- Improved plugin cleanup
- Deactivating the plugin now clears any scheduled sync events
- Deleting the plugin now removes its stored settings, credentials, and caches (your charts and themes are left in place)
- Improved front end efficiency, theme fonts are now compiled once and cached instead of being rebuilt on every page load
- Improved admin efficiency, a missing or invalid Google Fonts API key no longer slows the admin down while it retries
- Fixed an issue where clearing all of a theme’s elements could leave charts rendering the old theme styling
- Fixed an issue where a trashed theme kept styling charts until it was permanently deleted
- Fixed an issue where the Points element’s Translucent colors didn’t apply when the source color wasn’t a hex value
- Fixed an issue where the legend spacing fix didn’t apply on charts with a subtitle
- Fixed an issue where a Legend Margin reserved empty space even when the legend was hidden
- Fixed an issue where the tooltip swatch styling could affect charts from other plugins on the same page
- Fixed an issue where changing an annotation’s Type (or a label’s font Style or Weight) right after dragging a slider could undo the change
- Fixed an issue where pie and doughnut annotations could drift when the chart used a custom radius, spacing, or a half-pie layout
- Fixed an issue where cross, line, and star point annotations on treemaps wouldn’t render without both a border color and width
- Fixed an issue where switching a Remote CSV chart to a single-sheet chart type didn’t trim the extra URLs
- Fixed an issue where overlapping syncs could load stale data when responses came back out of order
- Fixed an issue where clearing the Height field above the theme builder preview collapsed the preview
1.0
- Initial release
M Chart
M Chart Pro
About the developer
Jamie Poitra lives in the Pacific Northwest with his wife and two daughters. He’s been working professionally in web and software development for over two decades now, over half of which he’s spent maintaining M Chart.
Open Source
M Chart the free core plugin is an MIT Licensed Open Source project which means others have contributed to it over the years in various ways. And my thanks go out to them all.
Please see the full list of contributors on Github.
As well as the list of translators on WordPress.
M Chart itself also relies on a variety of Open Source projects and my thanks go out to the many developers who contributed to these projects as well.
M Chart
- Jspreadsheet CE
- Chart.js
- chartjs-plugin-datalabels
- chartjs-chart-boxplot
- chartjs-chart-treemap
- chartjs-chart-venn
- parsecsv
M Chart Pro