


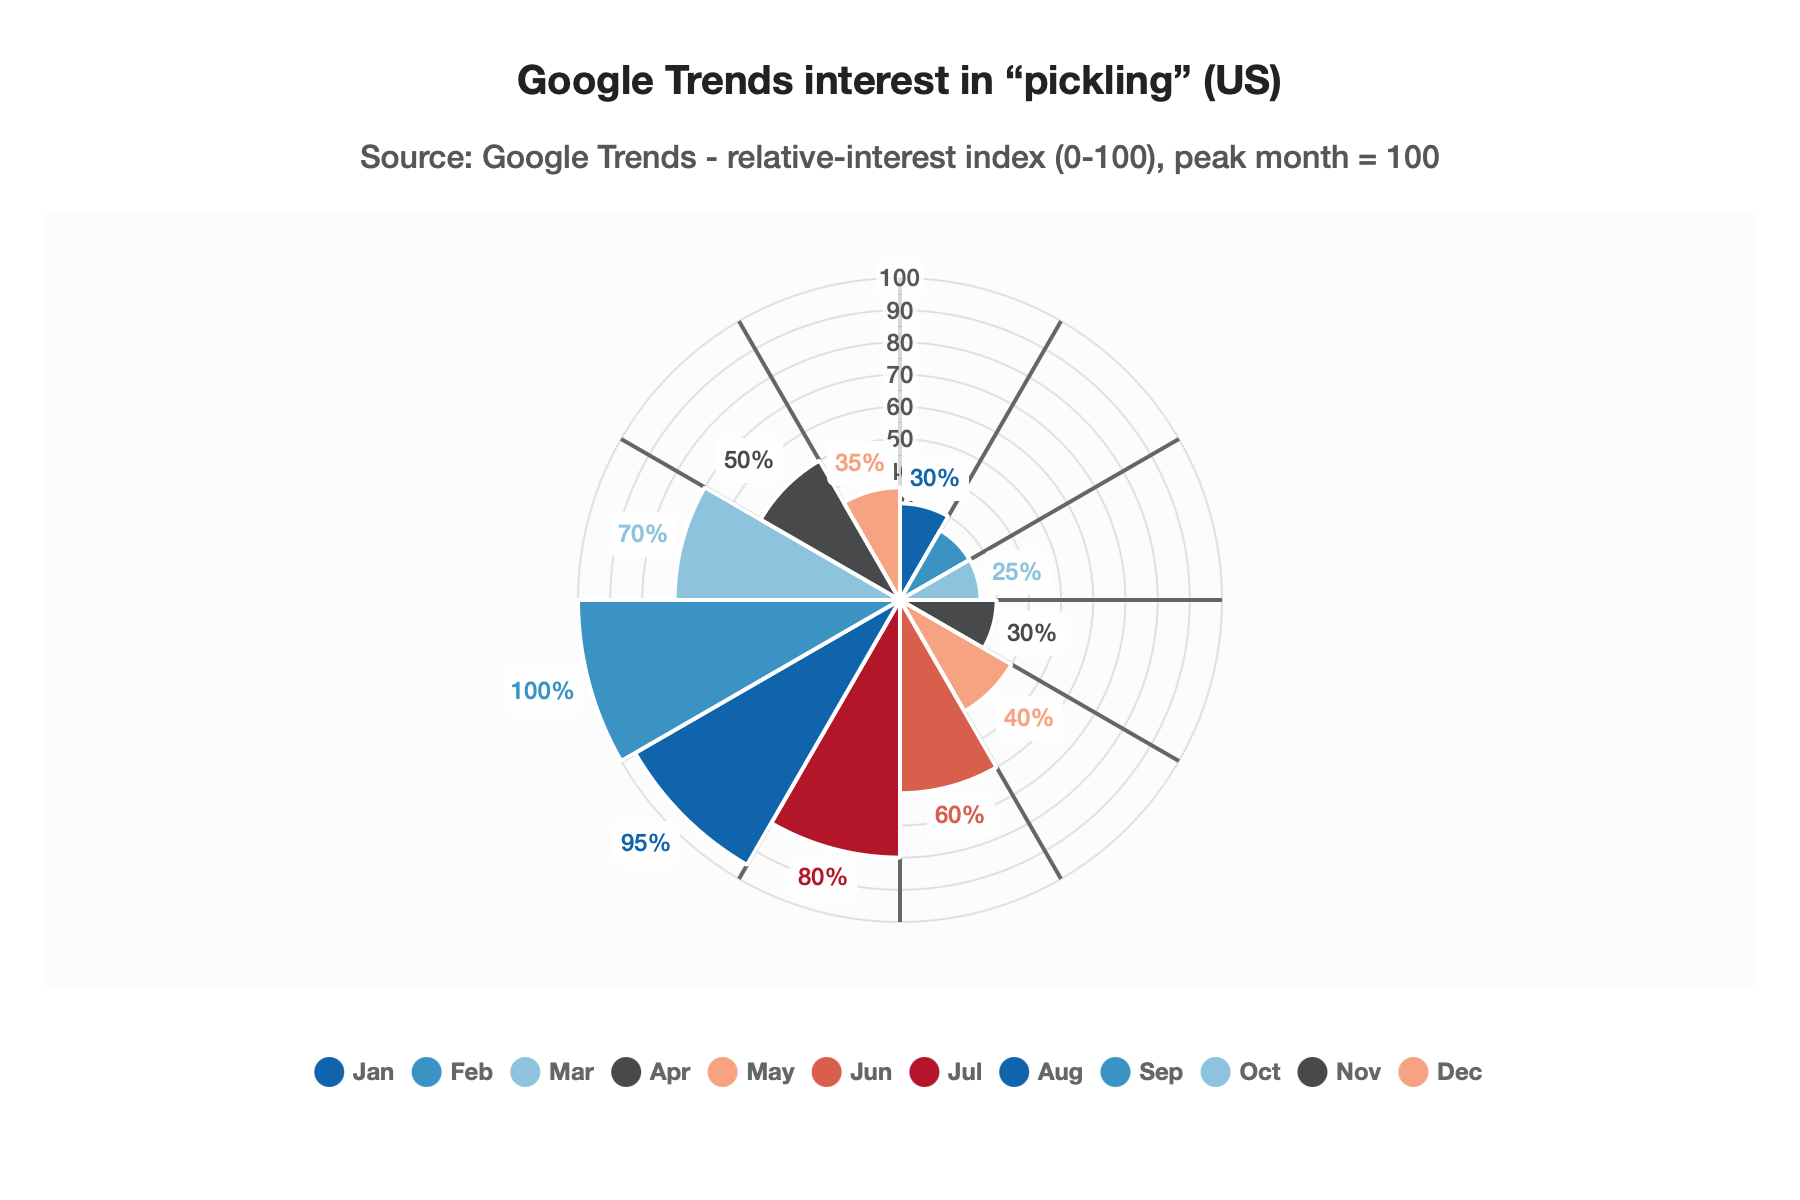
Polar chart. Source: Google Trends – relative-interest index (0-100), peak month = 100. Data table with 12 rows and 2 columns follows.
| Jan | 30% |
|---|---|
| Feb | 25% |
| Mar | 25% |
| Apr | 30% |
| May | 40% |
| Jun | 60% |
| Jul | 80% |
| Aug | 95% |
| Sep | 100% |
| Oct | 70% |
| Nov | 50% |
| Dec | 35% |
·
Polar chart. Source: Google Trends – relative-interest index (0-100), peak month = 100. Data table with 12 rows and 2 columns follows.
| Jan | 30% |
|---|---|
| Feb | 25% |
| Mar | 25% |
| Apr | 30% |
| May | 40% |
| Jun | 60% |
| Jul | 80% |
| Aug | 95% |
| Sep | 100% |
| Oct | 70% |
| Nov | 50% |
| Dec | 35% |