

About M Chart
A free WordPress charting plugin that’s been quietly powering charts on thousands of sites for over a decade.
A bit of history
M Chart started with a simple goal: give WordPress an efficient, easy-to-use way to manage data sets in a spreadsheet and display them as charts. Nothing more, nothing less. Over 10+ years it has grown to support 17 chart types, multiple output formats, and full accessibility, while staying free and focused.
Would like a more detailed history and a description of where things are headed?
What M Chart does
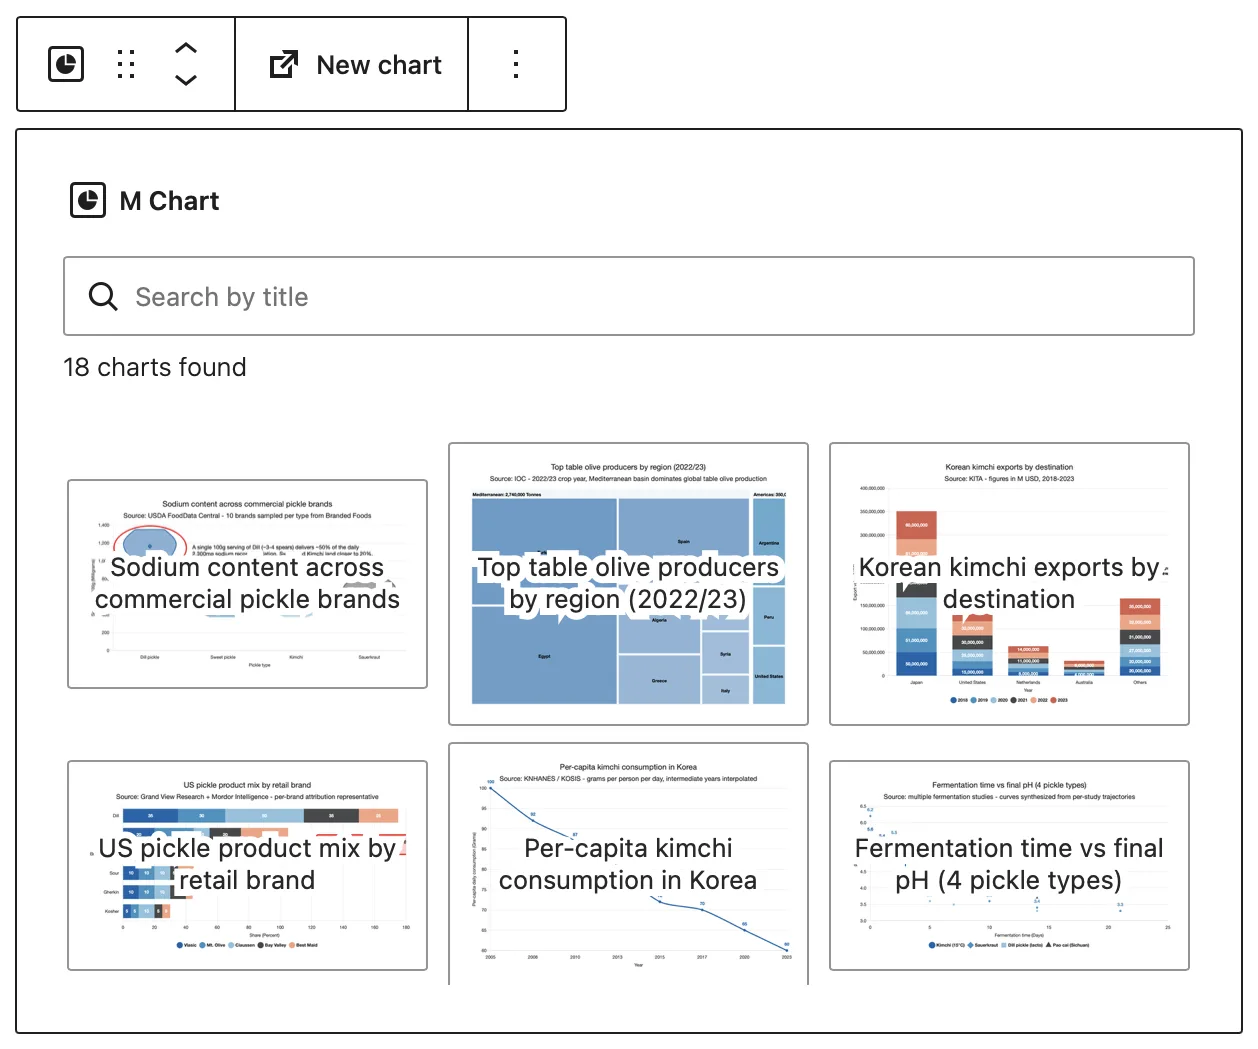
- 17 chart types — line, spline, area, column, stacked column, bar, stacked bar, pie, doughnut, scatter, bubble, radar, radar area, polar, treemap, boxplot, and violin
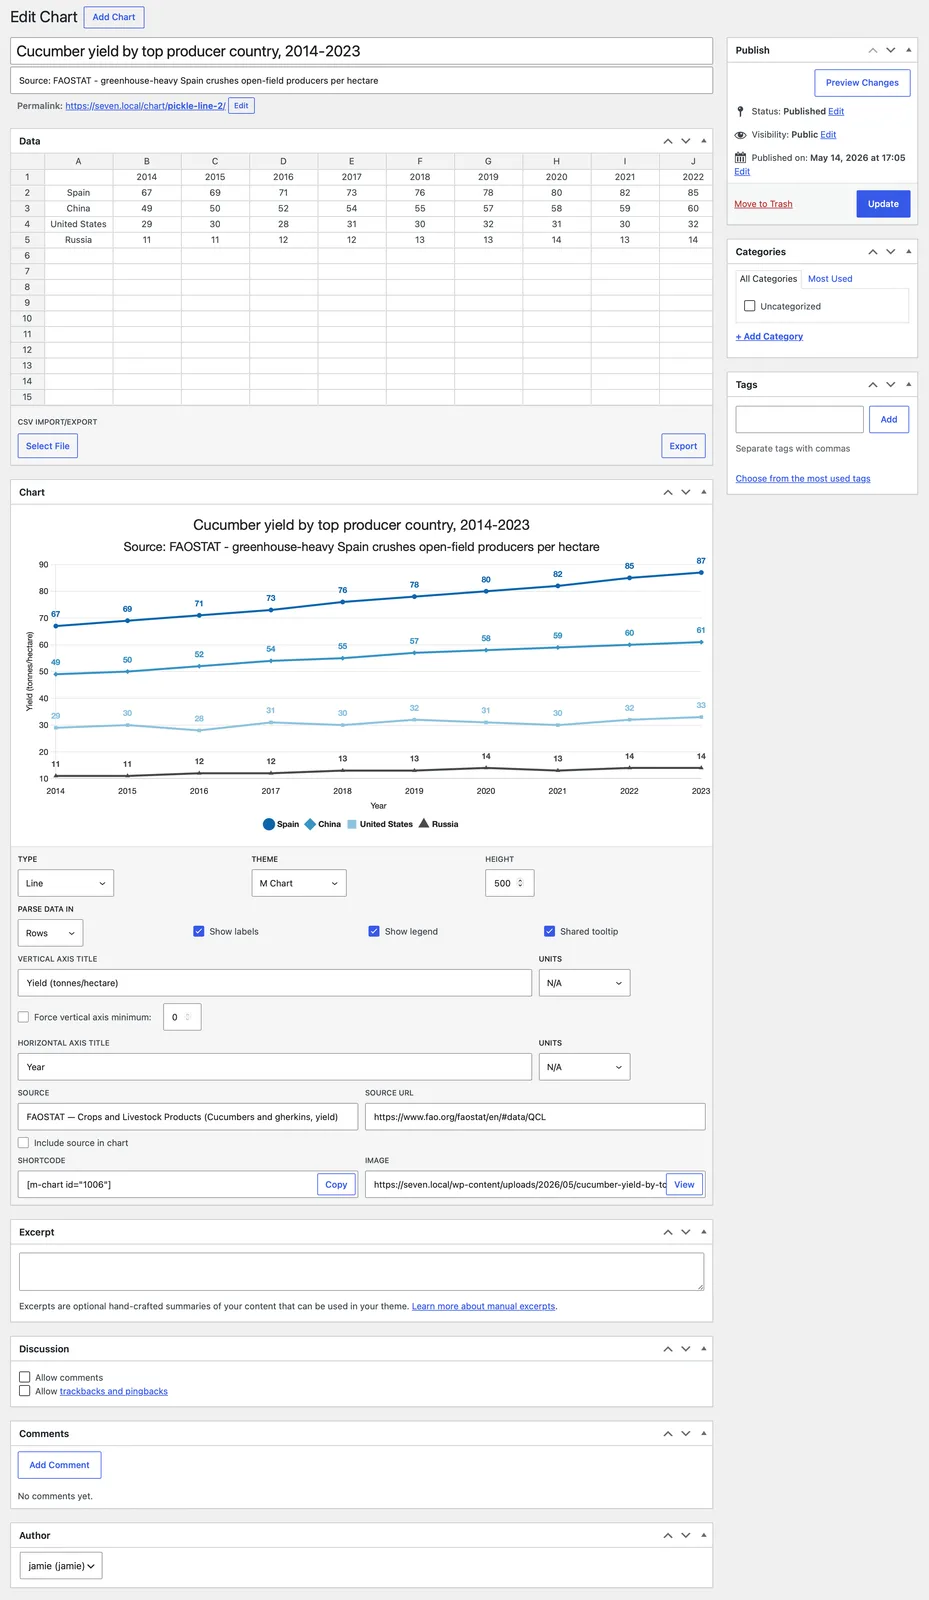
- Two ways to enter data — a spreadsheet UI (Jspreadsheet CE) with multi-sheet support, or a fully keyboard-accessible CSV import with configurable delimiters
- Live preview — the chart redraws instantly as you edit your data and settings, so you can see exactly what you’ll get before publishing
- *Multiple output formats — render as a live interactive chart, a static image, or a plain HTML data table, all from the same chart
- Automatic image generation — every chart is captured to a real PNG image automatically (no headless browser or external service required)
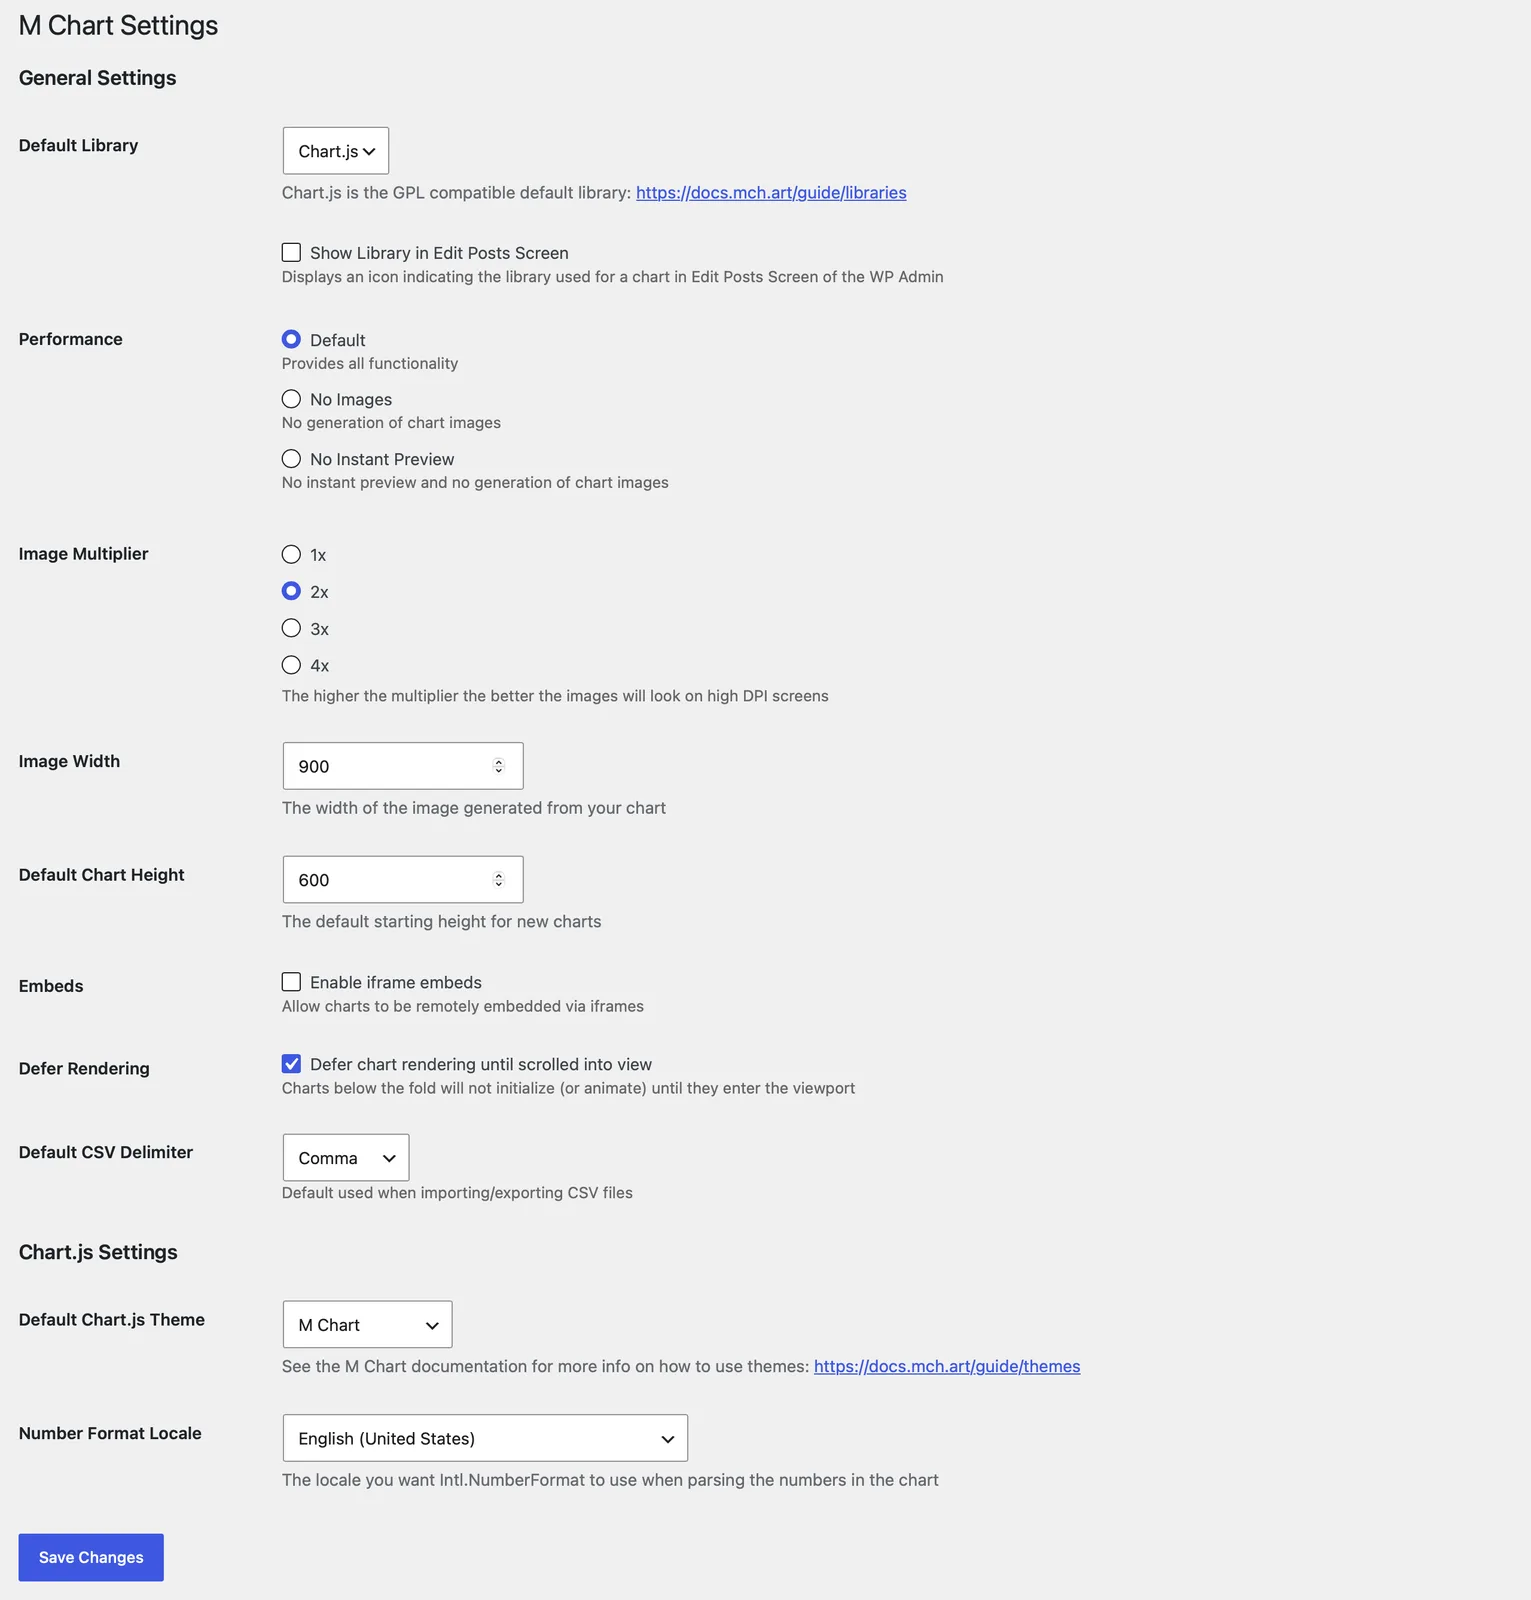
- Images have a configurable width and 1x–4x quality multiplier
- Perfect for RSS feeds, emails, AMP pages, and anywhere JavaScript doesn’t work
- Flexible embedding — shortcode, native block editor block, or iframe for remote/cross-site embedding
- Accessibility (WCAG 2.1 AA) — every front-end chart includes a visually-hidden data table for screen readers, and a Color Blind Safe theme is bundled
- Themes — bundled Chart.js themes, switchable per install, including a Color Blind Safe palette
- Responsive and fast — charts size to their container, defer rendering until scrolled into view, and lazy-load in the block editor
- Localization — locale-aware number formatting, plus full translation support
- Per-chart customization — title/subtitle, axis titles and units, forced axis minimum, legend and shared-tooltip toggles, data-point labels, source attribution, and “color per data point”
What M Chart Pro adds
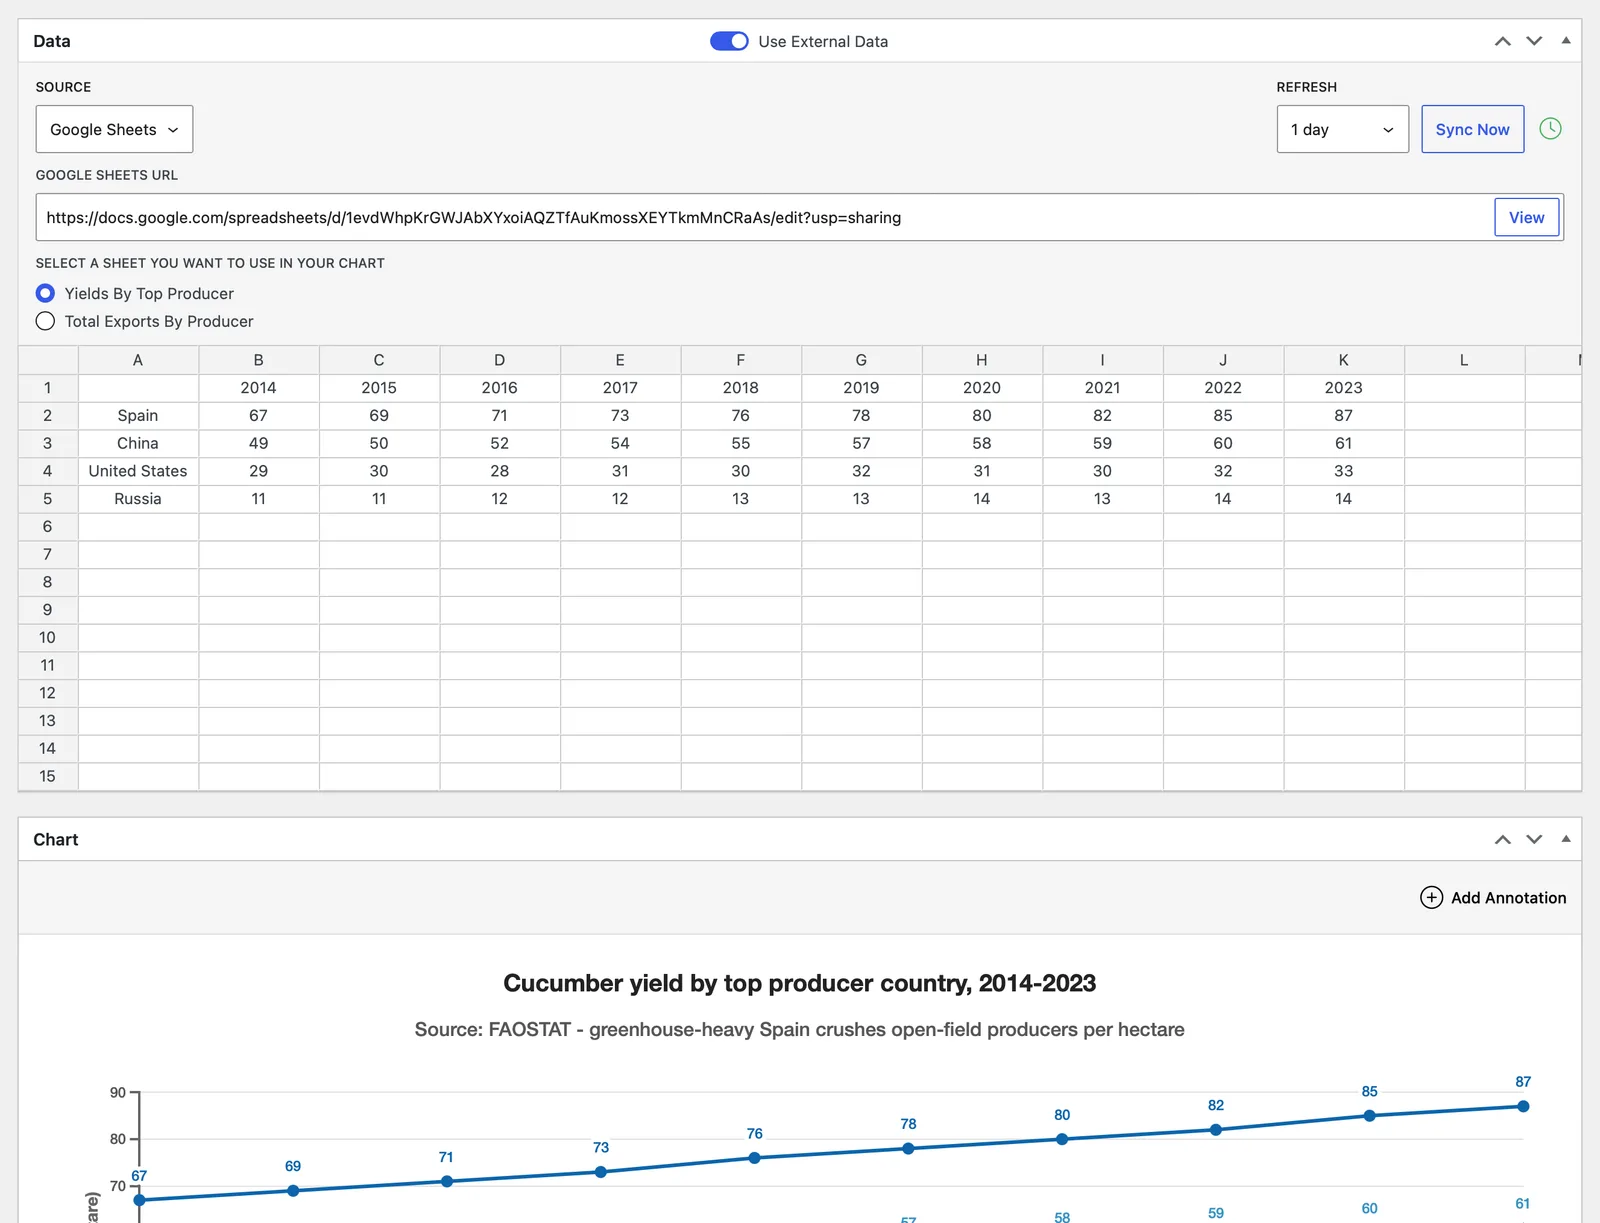
- External Data — keep a chart’s data in sync with a spreadsheet or file hosted elsewhere, so you never re-enter numbers by hand.
- Google Sheets — paste a share link and pick one or more tabs, each becoming its own data set; private sheets are supported through a Google service account
- Remote CSV — pull from one or more CSV URLs, named per data set, using your site’s CSV delimiter
- Scheduled auto-refresh — refresh every 30 minutes, hour, 6 or 12 hours, or 1, 2, or 3 days, set per chart or from a global default
- Sync Now — refresh on demand from the chart editor, even with an unsaved URL
- Status at a glance — a Sync column on the Charts list shows OK, Error, or Never, and an admin notice flags any chart that fails repeatedly, with its error
- Safe by design — a failed sync leaves your existing data untouched and retries on the next interval, and remote URLs are validated to block server-side request forgery
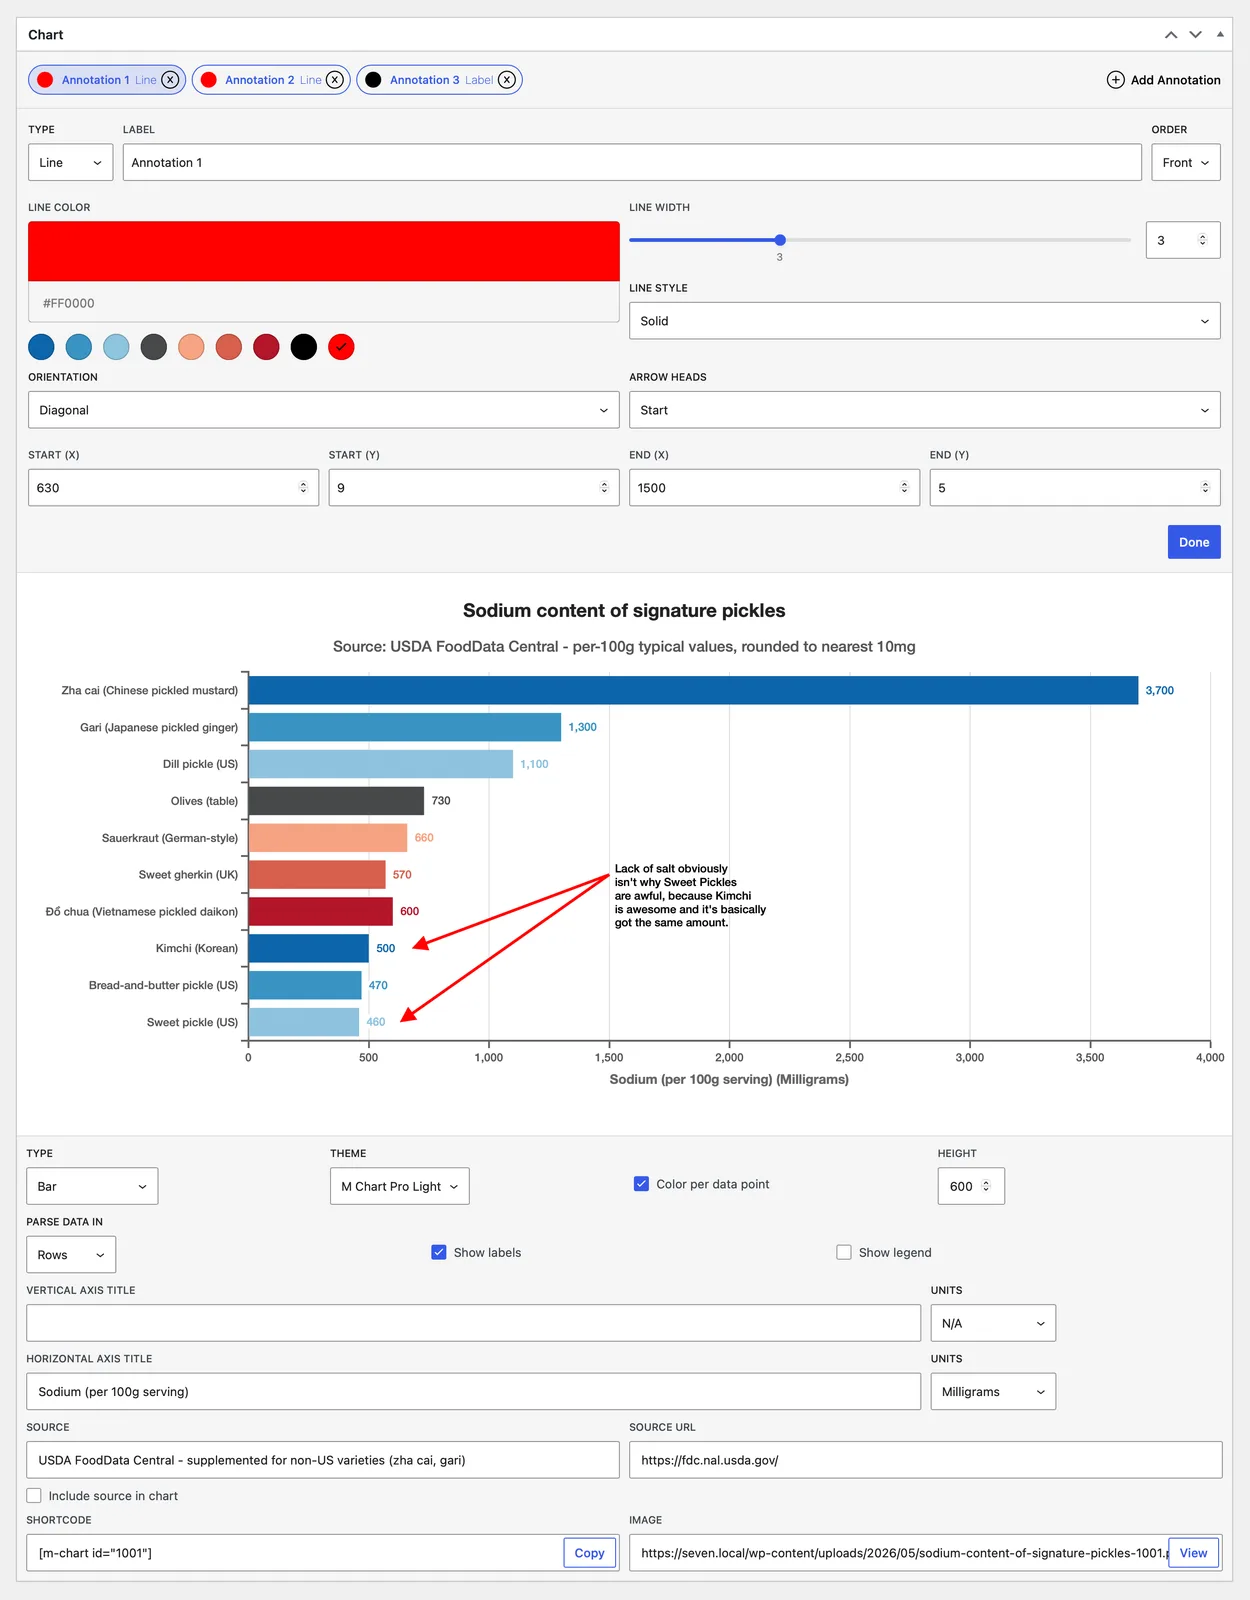
- Annotations — mark up a chart with lines, shapes, and text that render on the live chart and in iframe embeds.
- Six types — Line (horizontal, vertical, or diagonal, with optional arrowheads), Box, Ellipse, Label, Point, and Polygon
- Round charts too — place annotations on pie, doughnut, radar, and polar charts by angle and distance from center, not just on X/Y charts; on treemaps, pin labels, points, and boxes to specific cells
- Full styling — border color, width, and dash; fill color; and, for labels, complete typography with an optional background box
- Built for editing — up to 50 per chart, drag to reorder, send to front or back, with a live preview as you place them
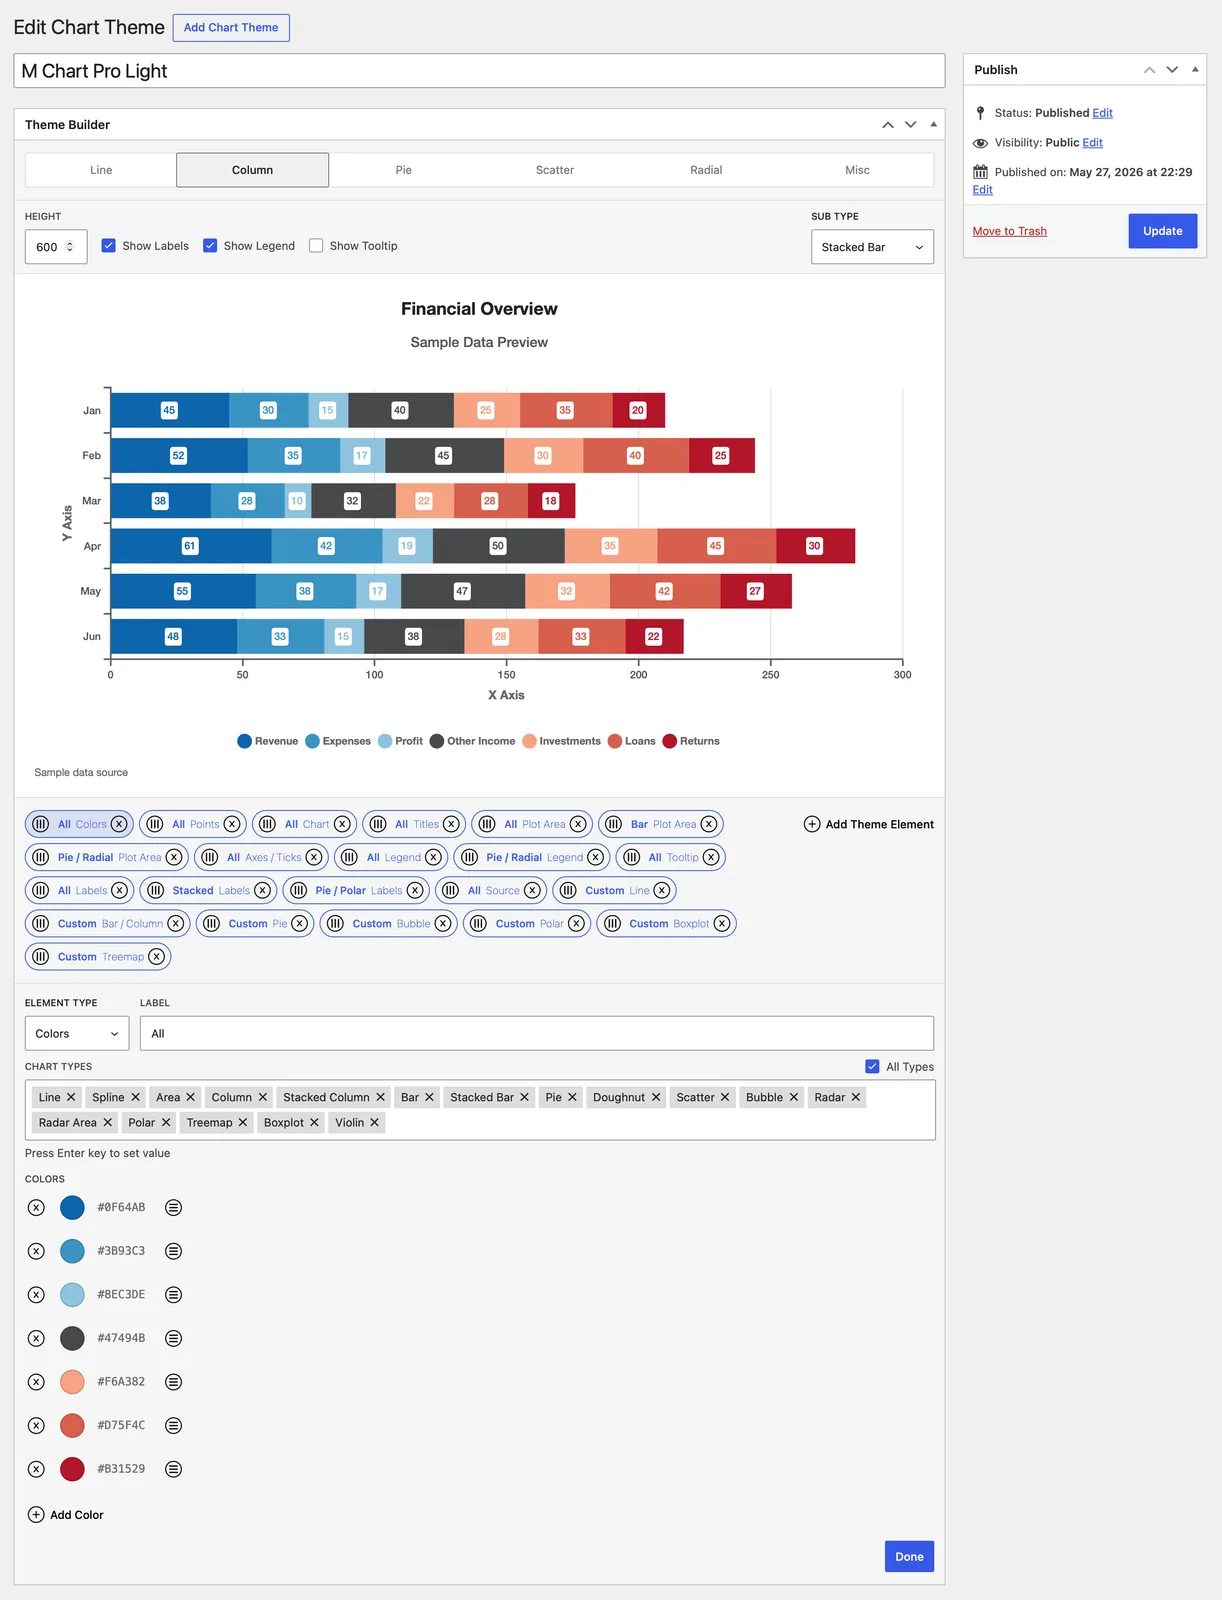
- Theme Builder — a visual Theme Builder for creating reusable, named themes that restyle every part of a Chart.js chart; two starter themes (M Chart Pro Light and Dark) are bundled, and the builder shows a live preview as you work just like you’re used to when editing your charts.
- Color palettes — define the series color cycle and set background, border, and fill colors, with opacity, throughout the chart
- Typography — built-in font stacks, Google Fonts or Adobe Fonts (auto-loaded for you), or your own @font-face, with independent size, weight, style, color, and alignment for titles, axis titles and labels, the legend, tooltips, and data labels
- Data styling for every chart family — line width, dash, curve, and fill; bar border, radius, and width; pie, doughnut, and polar slice spacing and “explode” offsets; point markers in several shapes with sizes and hover styles; plus bubble, treemap, and boxplot/violin
- Layout and chrome — chart padding and background; plot-area background, border, and gridlines; legend position and spacing; tooltip styling; and axis lines, ticks, and labels — including radial grid shape, angle lines, and tick backdrops for round charts
- On-chart overlays — add custom text, an image or logo, and a source-attribution line, layered in front of or behind the data
- Targeted styling — scope any styling element to all chart types or only specific ones, with up to 50 elements per theme
M Chart
M Chart Pro
About the developer
Jamie Poitra lives in the Pacific Northwest with his wife and two daughters. He’s been working professionally in web and software development for over two decades now, over half of which he’s spent maintaining M Chart.