


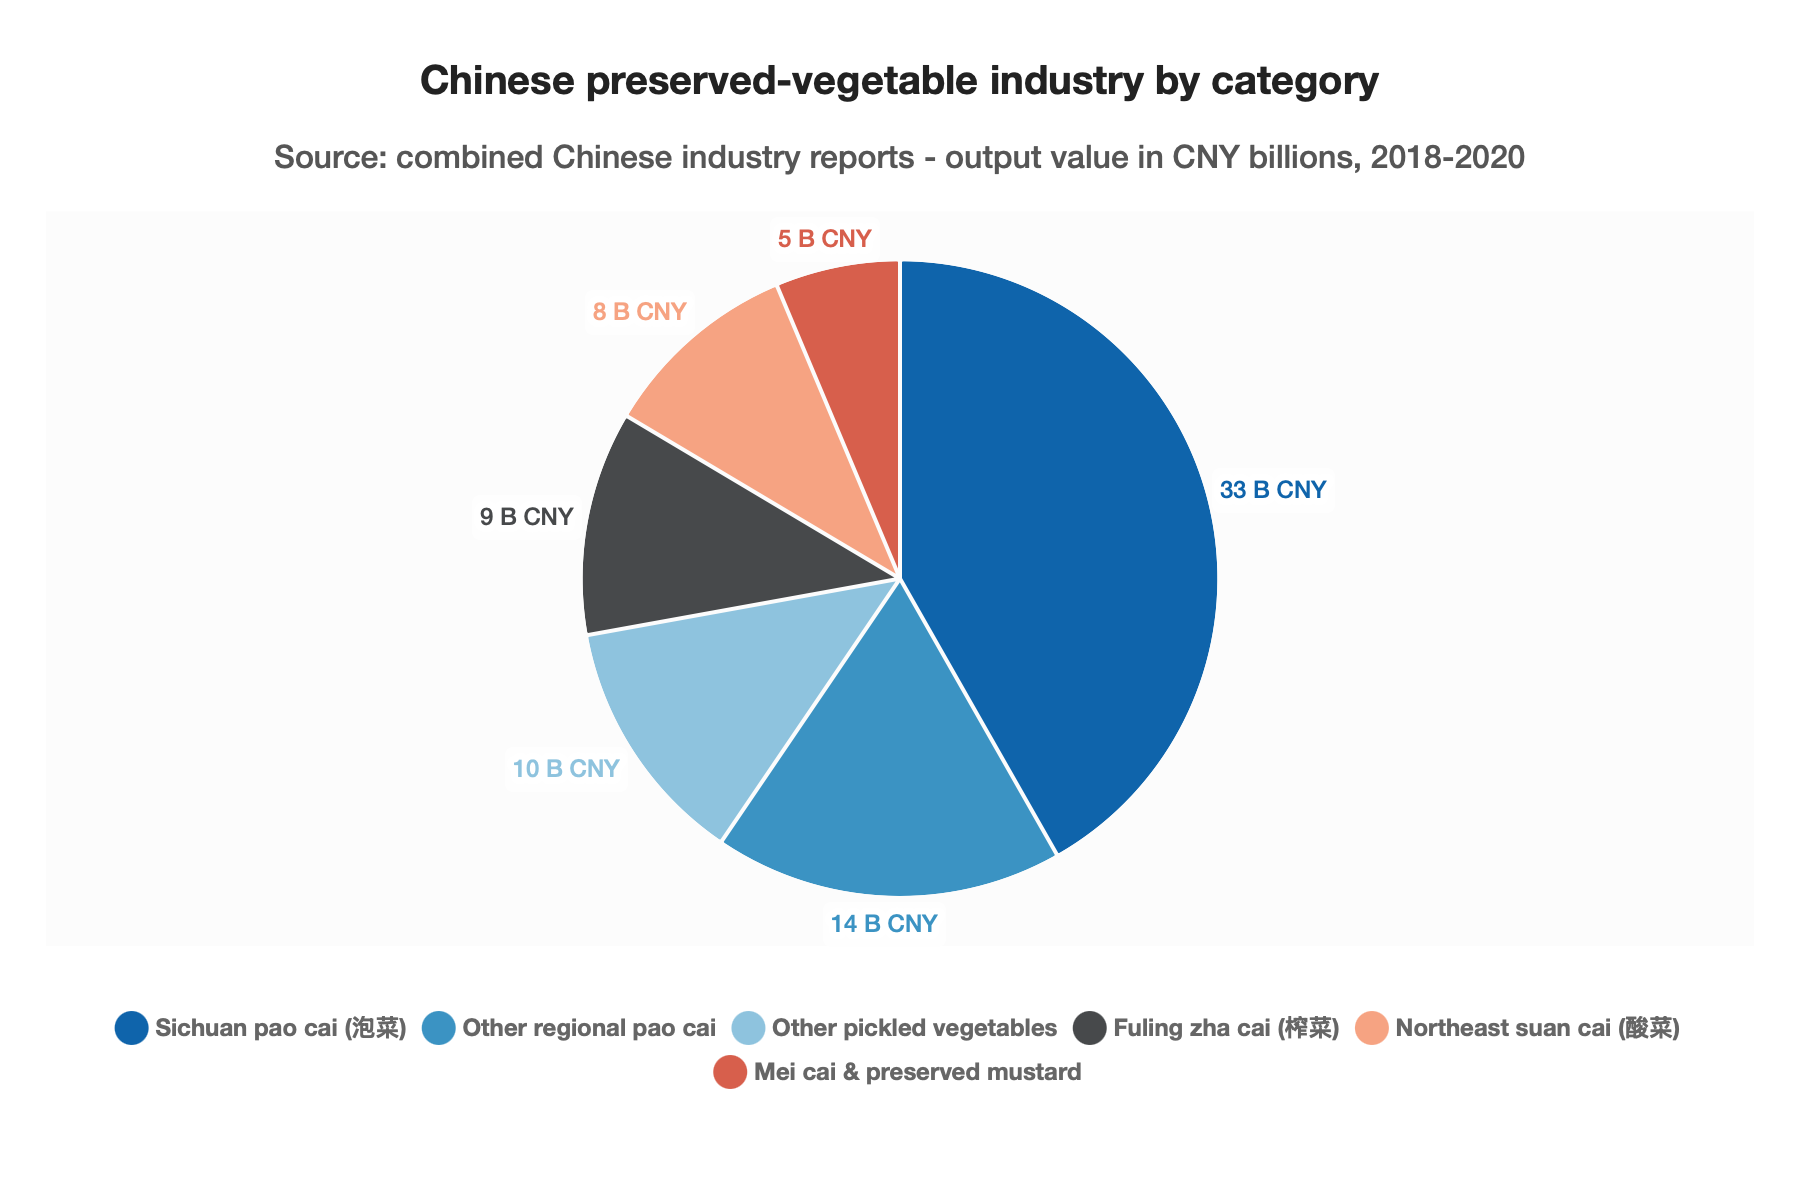
Pie chart. Source: combined Chinese industry reports – output value in CNY billions, 2018-2020. Data table with 6 rows and 2 columns follows.
| Sichuan pao cai (泡菜) | 33 B CNY |
|---|---|
| Other regional pao cai | 14 B CNY |
| Other pickled vegetables | 10 B CNY |
| Fuling zha cai (榨菜) | 9 B CNY |
| Northeast suan cai (酸菜) | 8 B CNY |
| Mei cai & preserved mustard | 5 B CNY |