


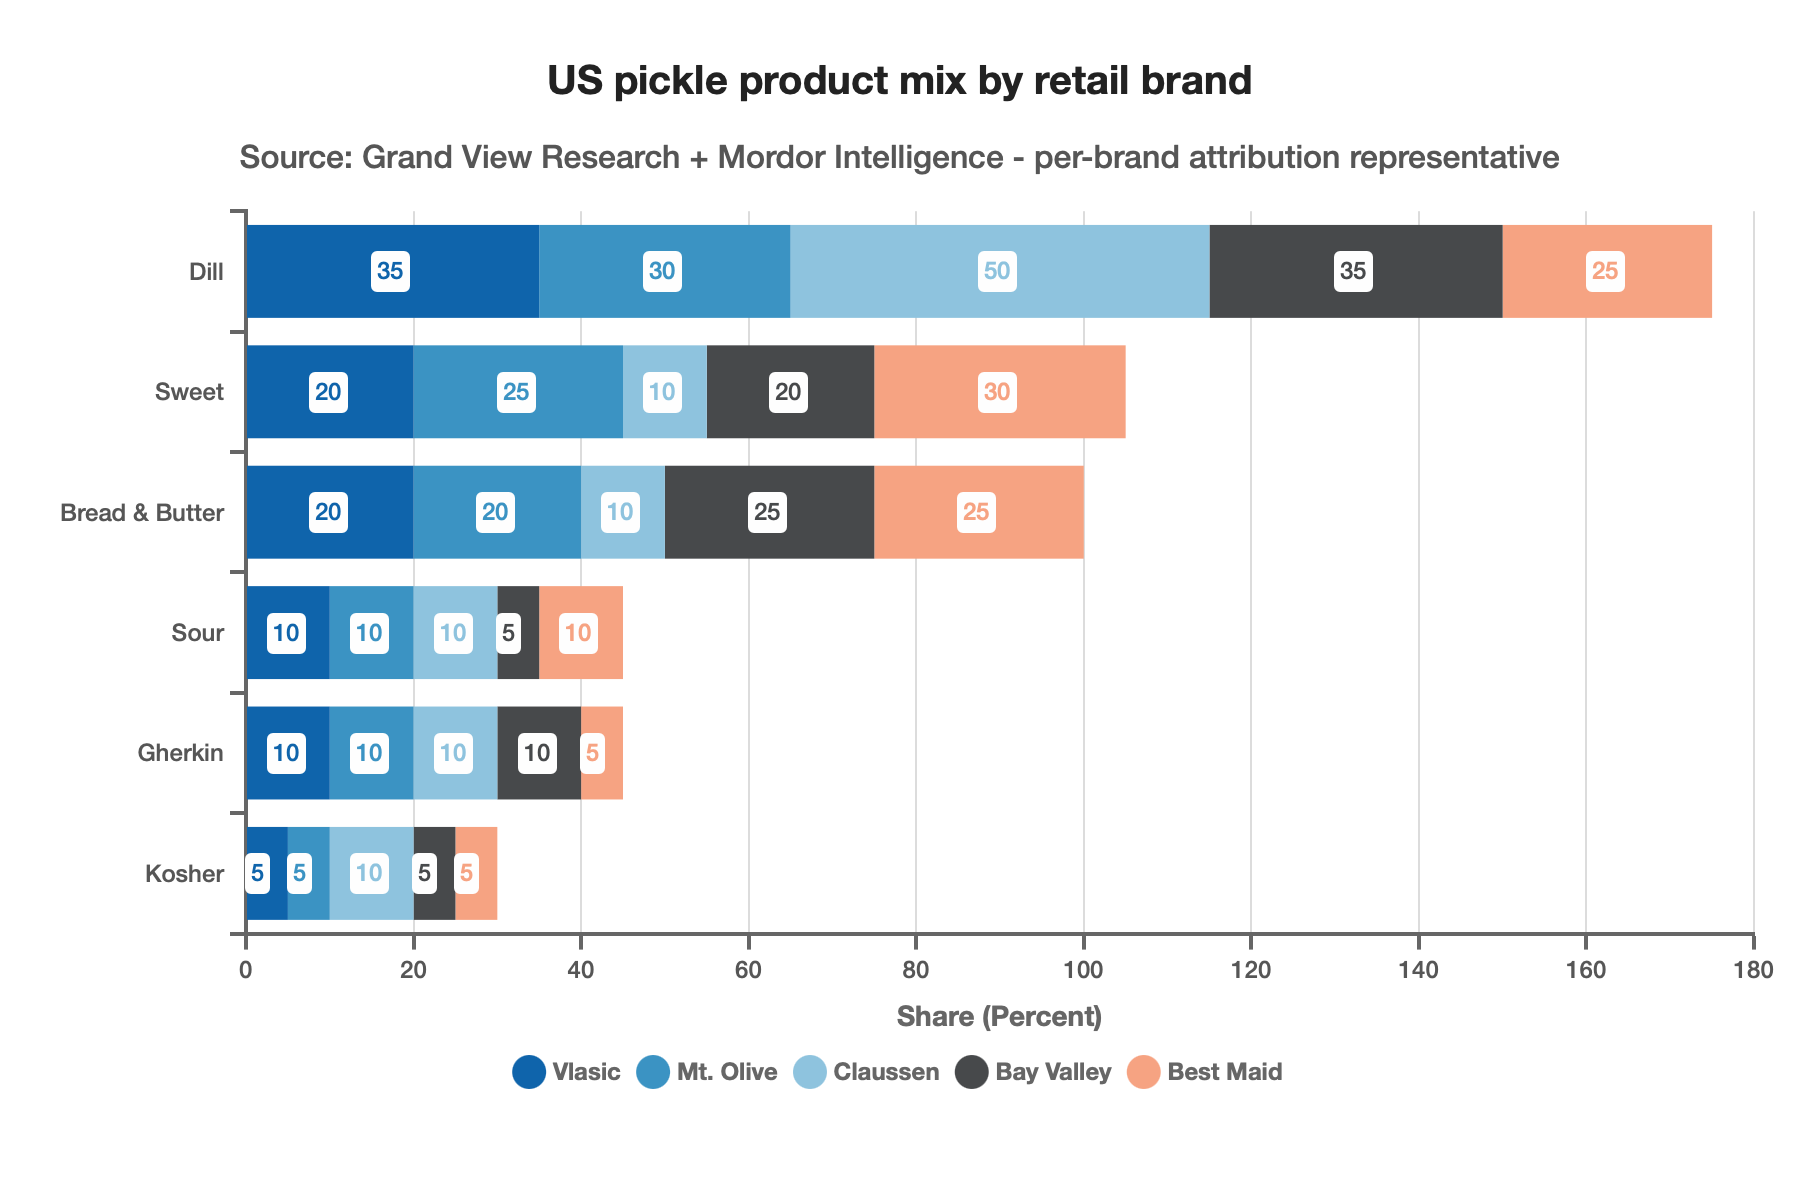
Stacked Bar chart. Source: Grand View Research + Mordor Intelligence – per-brand attribution representative. Data table with 6 rows and 7 columns follows.
| Dill | Sweet | Bread & Butter | Sour | Gherkin | Kosher | |
|---|---|---|---|---|---|---|
| Vlasic | 35 | 20 | 20 | 10 | 10 | 5 |
| Mt. Olive | 30 | 25 | 20 | 10 | 10 | 5 |
| Claussen | 50 | 10 | 10 | 10 | 10 | 10 |
| Bay Valley | 35 | 20 | 25 | 5 | 10 | 5 |
| Best Maid | 25 | 30 | 25 | 10 | 5 | 5 |