


Images
M Chart captures a PNG of every chart automatically, with a configurable width and 1×–4× quality settings. This means your emails, RSS feeds, AMP pages, and other no-JavaScript contexts always have a usable fallback.
One chart, two ways
Every M Chart embed is an interactive chart, and M Chart captures a static PNG of it automatically. Use the image anywhere JavaScript can’t run.
Live, interactive
Line chart. Source: FAOSTAT – greenhouse-heavy Spain crushes open-field producers per hectare. Data table with 5 rows and 11 columns follows.
| 2014 | 2015 | 2016 | 2017 | 2018 | 2019 | 2020 | 2021 | 2022 | 2023 | |
|---|---|---|---|---|---|---|---|---|---|---|
| Spain | 67 | 69 | 71 | 73 | 76 | 78 | 80 | 82 | 85 | 87 |
| China | 49 | 50 | 52 | 54 | 55 | 57 | 58 | 59 | 60 | 61 |
| United States | 29 | 30 | 28 | 31 | 30 | 32 | 31 | 30 | 32 | 33 |
| Russia | 11 | 11 | 12 | 12 | 13 | 13 | 14 | 13 | 14 | 14 |
Hover for tooltips and toggle series in the legend. Rendered with Chart.js in the browser.
Static image (PNG)
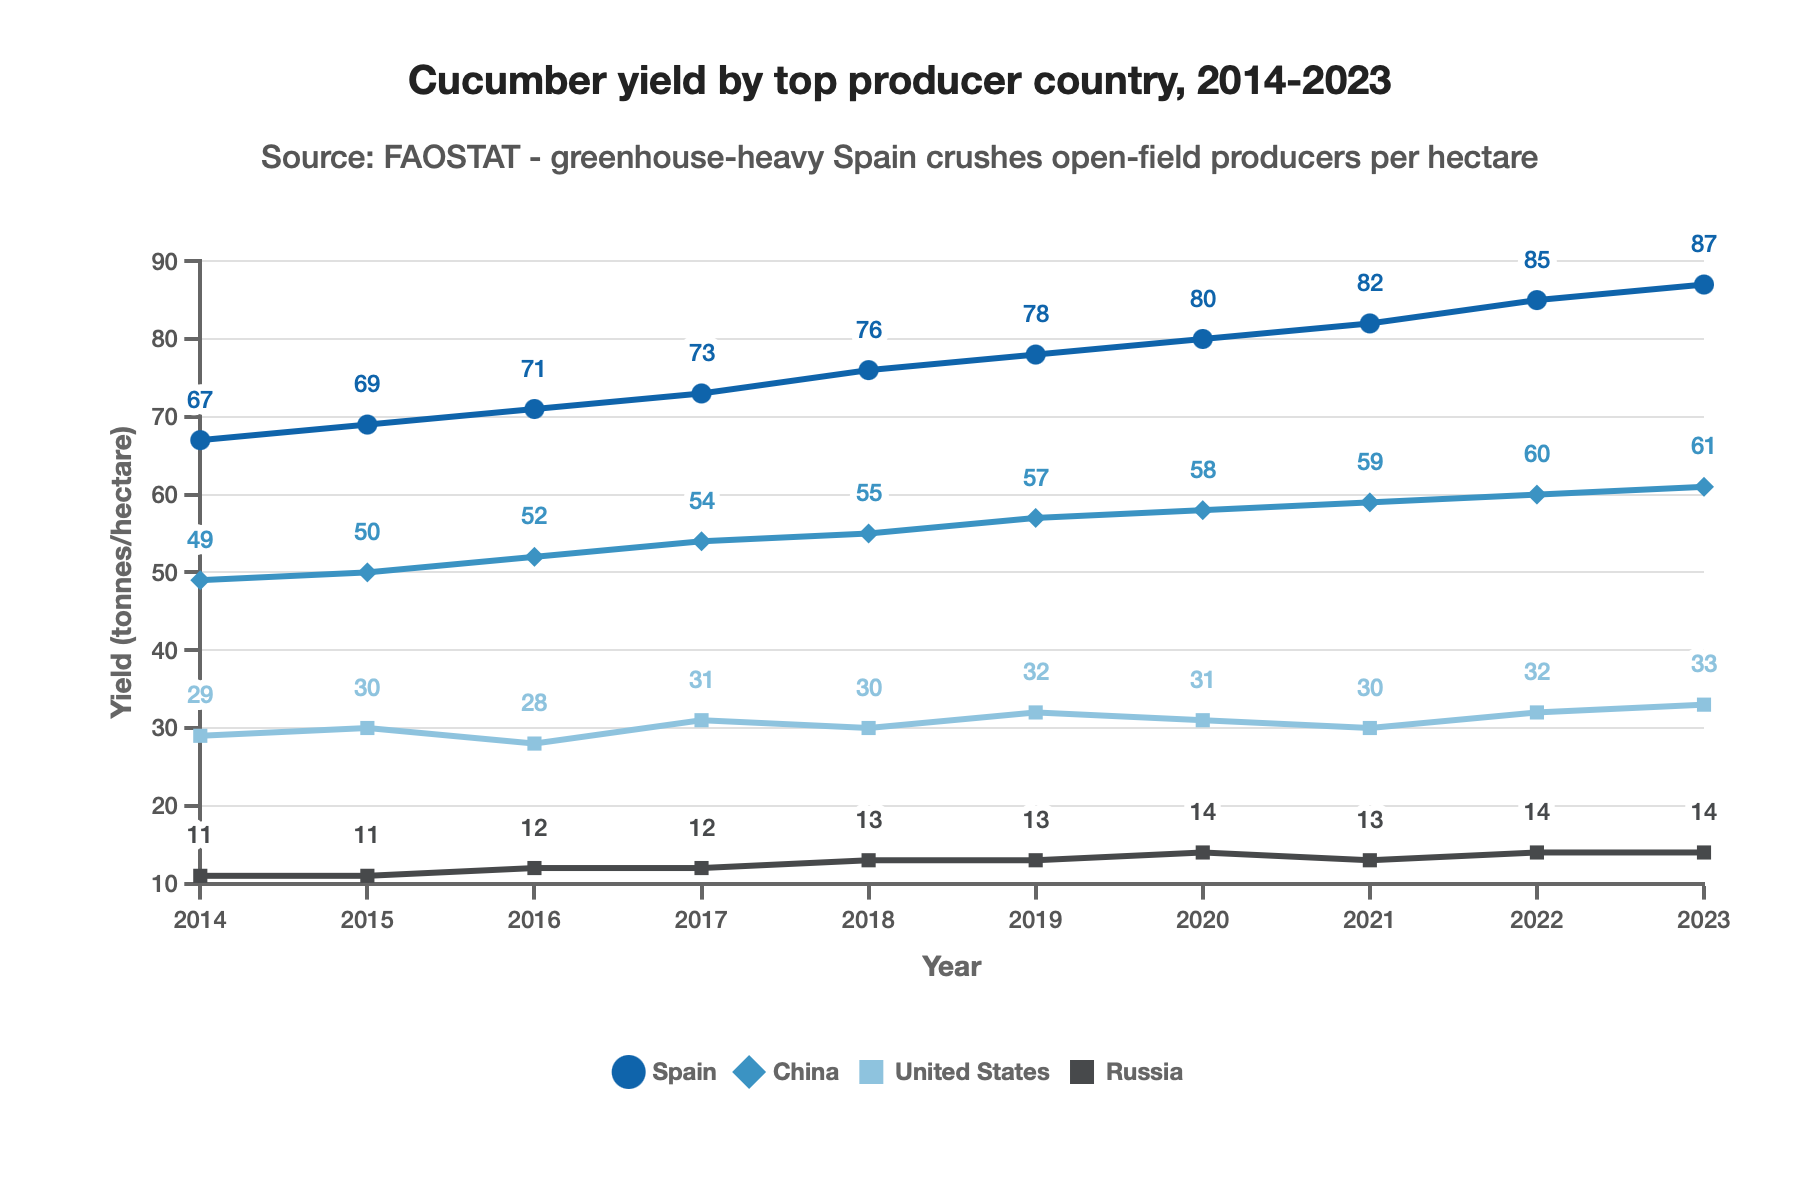
The same chart as an auto-generated PNG, used for email, RSS, AMP, and no-JavaScript fallback.